DYJ ThreeMACrossAlarm
- Indicadores
-
Daying Cao
 ¡Hola! Soy un ingeniero de software ha estado desarrollando durante muchos years.have su propio sistema de comercio único, tiene una riqueza de EA experiencia comercial. La moneda principal es EUR / USD, GBP / USD. USD / JPY, AUD / USD, USD / CAD, oro, EUR / NZD moneda cruzada. EA corriendo para
 - Versión: 1.0
- Activaciones: 5
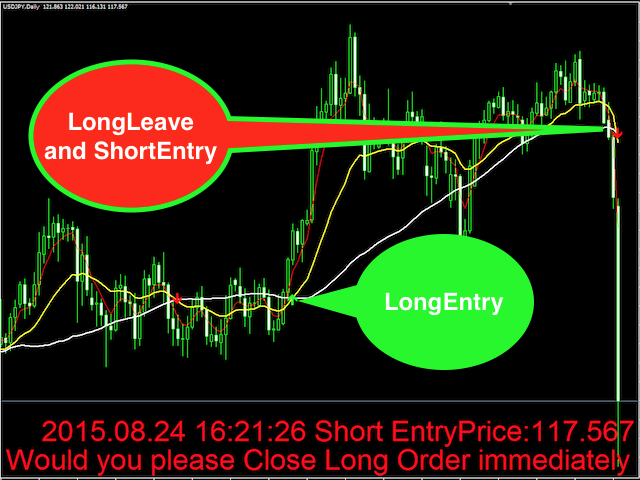
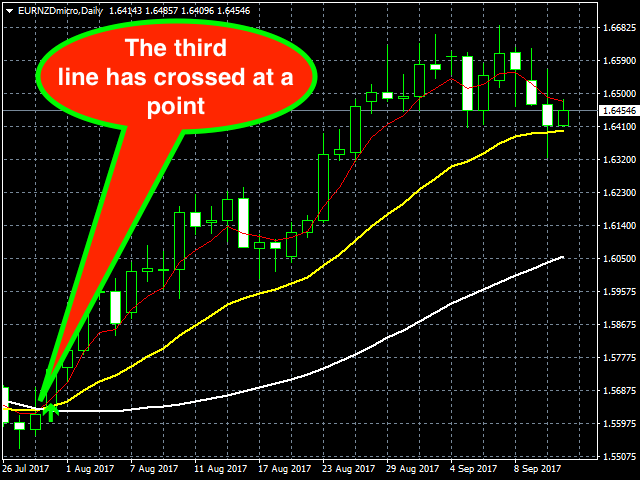
Este indicador muestra el cruce entre tres medias móviles (lenta, media y rápida). Cuando la MA rápida cruza hacia arriba la MA media y la MA media cruza hacia arriba la MA lenta, se emite una alerta alcista. Cuando la MA rápida cruza hacia abajo la MA media y la MA media cruza hacia abajo la MA lenta, se emite una alerta bajista. Las señales para cerrar posiciones de compra se generan si la MA rápida cruza la MA media hacia abajo, las señales para cerrar posiciones de venta se generan si la MA rápida cruza la MA media hacia arriba.
Entradas
Configuración de la MA rápida
- MAPeriod1 = 5 - periodo de la Media Móvil más rápida (valor 5).
- MAMethod1 = EMA - tipo de Media Móvil (SMA, EMA, SMMA, LWMA).
- MAPriceType1 = Close - tipo de precio (Close, Open, Low, High, Median, Typical, Weighted).
Configuración de MA Media
- MAPeriod2 = 20 - período de la MA media (valor 20).
- MAMethod2 = EMA - tipo de media móvil (SMA, EMA, SMMA, LWMA).
- MAPriceType2 =Close - tipo de precio (Close, Open, Low, High, Median, Typical, Weighted).
Configuración de MA Lenta
- MAPeriod3 = 50 - período de la MA lenta (valor 50).
- MAMethod3 = SMA - tipo de Media Móvil (SMA, EMA, SMMA, LWMA).
- MAPriceType3 = Close - tipo de precio (Close, Open, Low, High, Median, Typical, Weighted).
Otros
- NumBarsToCross = 3 - número de barras a cruzar.
- SoundAlert =true - mostrar alerta emergente.
- EmailAlert =true - notificaciones a su correo electrónico.
- PushAlert = true - notificaciones a su dispositivo móvil.
- LimitBars = 800 - límite de barras.
Autor
- Daying Cao, un ingeniero de software con experiencia.