Fractal Levels MTF for MT5
- Indicadores
- Versión: 1.0
- Activaciones: 5

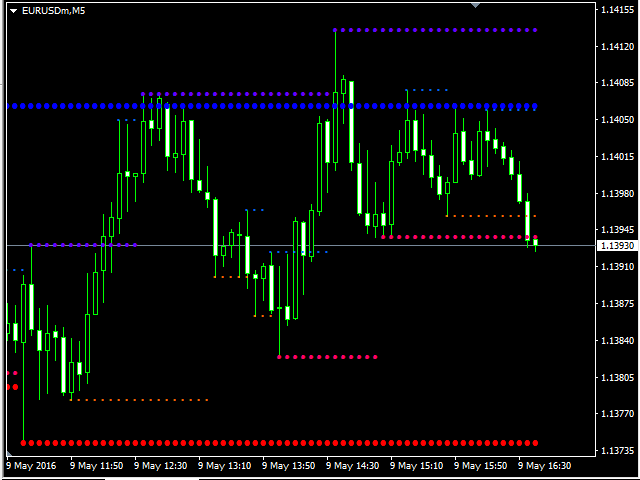
El indicador muestra los niveles fractales de uno, dos o tres marcos temporales superiores diferentes comenzando por el actual. Cuando aparece un nuevo fractal, se traza un nuevo nivel. El indicador puede utilizarse para el análisis visual del gráfico actual y aplicarse en un EA. Si se necesitan más niveles, inicie una nueva instancia del indicador.
Características
- El indicador funciona en cualquier marco temporal y símbolo.
- Si en los ajustes se selecciona un marco temporal más pequeño que el actual, se muestra el nivel del marco temporal actual.
- La capacidad de mostrar los niveles que no son extremos de precios (fractal), pero son los niveles de cierre de las velas (cerca de fractal).
- El bloqueo de varias notificaciones cuando el precio alcanza el nivel fractal o lo cruza (puede activar/desactivar cada señal).
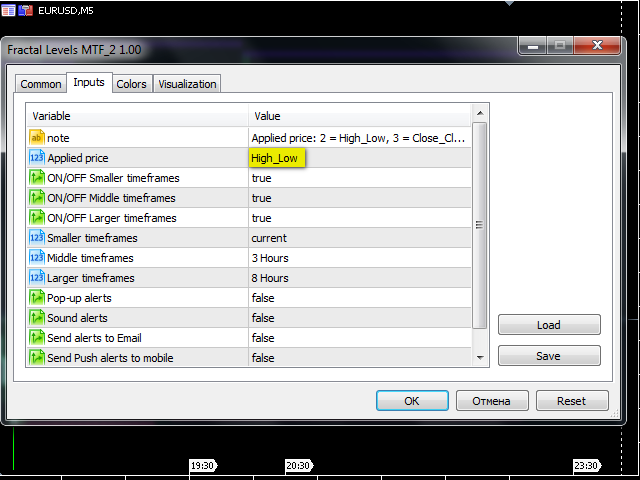
Entradas
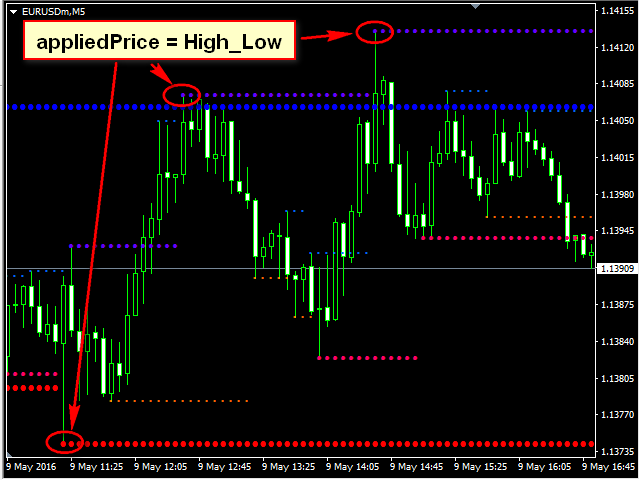
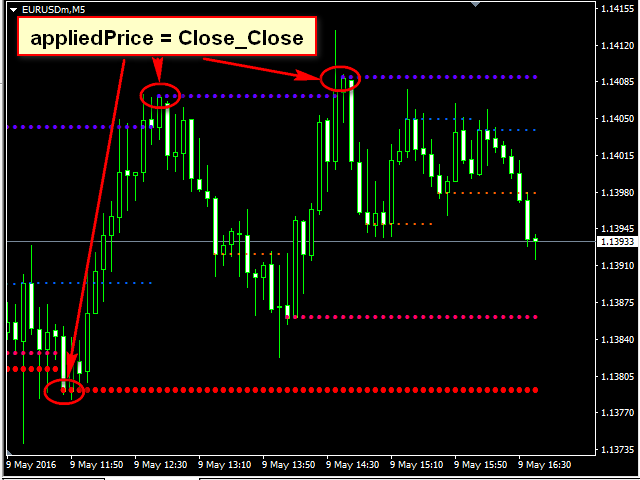
- Precio aplicado: precio utilizado para dibujar los niveles. Hay dos opciones:
- High_Low: precios máximo y mínimo (fractal);
- Close_Close: precio de cierre de la vela, más cercano al fractal;
Cuando se utiliza el indicador en el EA, el parámetro High_Low corresponde al número 2, mientras que Close_Close al número 3. - ON/OFFPlazos menores: activar/desactivar el primer nivel;
- ON/OFF Plazos medios: activar/desactivar el segundo nivel;
- ON/OFF Plazos mayores: activar/desactivar el tercer nivel;
- Temporogramasmenores: temporización del primer nivel;
- Temporizacionesmedias: temporización del segundo nivel;
- Plazosmayores: plazo del tercer nivel;
- Alertasemergentes: activar/desactivar las alertas emergentes en el terminal;
- Alertassonoras: activar/desactivar la alerta sonora;
- Enviar alertasa Email: habilitar/deshabilitar las notificaciones por email;
- Enviar alertasPush al móvil: habilitar/deshabilitar las notificaciones push al terminal móvil.
Los ajustes de color y anchura son estándar.


El usuario no ha dejado ningún comentario para su valoración