Fractal Levels MTF for MT5
- Indikatoren
- Version: 1.0
- Aktivierungen: 5

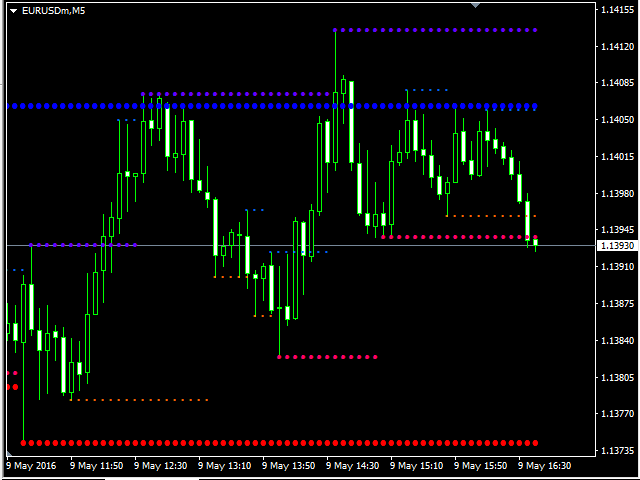
Der Indikator zeigt die fraktalen Niveaus von einem, zwei oder drei verschiedenen höheren Zeitrahmen an, beginnend mit dem aktuellen Zeitrahmen. Wenn ein neues Fraktal auftaucht, wird ein neues Niveau eingezeichnet. Der Indikator kann zur visuellen Analyse des aktuellen Charts verwendet und in einem EA eingesetzt werden. Wenn mehr Levels benötigt werden, starten Sie eine neue Instanz des Indikators.
Eigenschaften
- Der Indikator funktioniert auf jedem Zeitrahmen und Symbol.
- Wenn in den Einstellungen ein kleinerer Zeitrahmen als der aktuelle ausgewählt wird, wird das Niveau des aktuellen Zeitrahmens angezeigt.
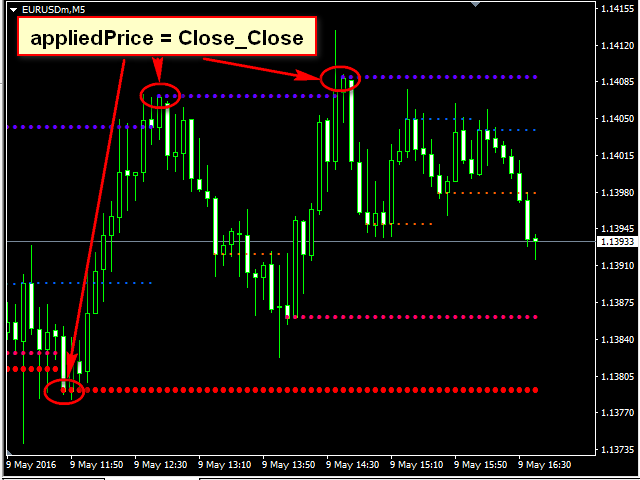
- Die Möglichkeit, die Niveaus anzuzeigen, die keine Preisextreme (Fraktal) sind, sondern die Schlussniveaus der Kerzen (Beinahe-Fraktal).
- Die Blockierung verschiedener Benachrichtigungen, wenn der Kurs das Fraktal-Niveau erreicht oder überschreitet (Sie können jedes Signal aktivieren/deaktivieren).
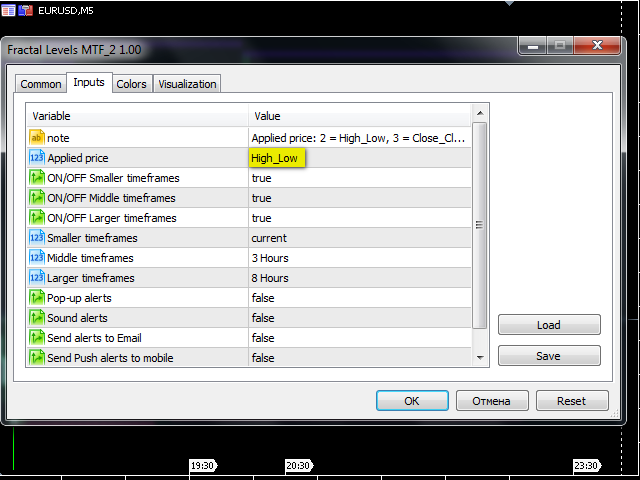
Eingaben
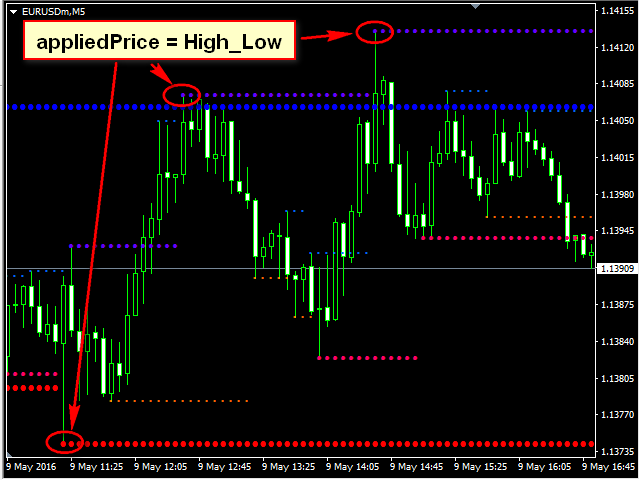
- Angewandter Preis: Preis, der zum Zeichnen der Niveaus verwendet wird. Es gibt zwei Optionen:
- High_Low: Höchst- und Tiefstpreis (Fraktal);
- Close_Close: Kerzenschlusskurs, der dem Fraktal am nächsten liegt;
Wenn der Indikator im EA verwendet wird, entspricht der Parameter High_Low der Nummer 2 und Close_Close der Nummer 3. - ON/OFF Kleinere Zeitrahmen: Aktivieren/Deaktivieren der ersten Ebene;
- ON/OFF Mittlere Zeitrahmen: Aktivieren/Deaktivieren der zweiten Stufe;
- ON/OFF Größere Timeframes: Aktivierung/Deaktivierung der dritten Ebene;
- Kleinere Zeitrahmen: Zeitrahmen der ersten Stufe;
- Mittlere Zeitrahmen: Zeitrahmen der zweiten Stufe;
- Größere Zeitrahmen: Zeitrahmen der dritten Ebene;
- Popup-Warnungen: Aktivieren/Deaktivieren von Popup-Warnungen im Terminal;
- Tonalarme: Aktivieren/Deaktivieren des Tonalarms;
- Alarme per E-Mail senden: E-Mail-Benachrichtigungen aktivieren/deaktivieren;
- Push-Benachrichtigungen an Mobiltelefon senden: Aktivieren/Deaktivieren von Push-Benachrichtigungen für das mobile Endgerät.
Die Einstellungen für Farbe und Breite sind Standard.


Der Benutzer hat keinen Kommentar hinterlassen