Trade Direction 4
- Indicadores
- Versión: 1.0
- Activaciones: 5

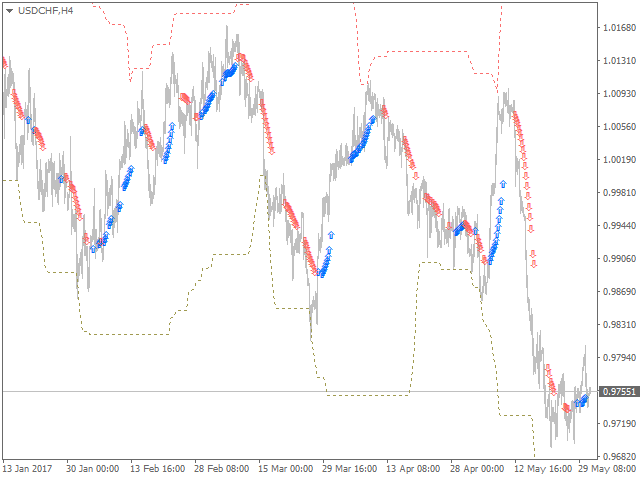
Este sencillo indicador ayuda a definir la dirección más probable de la tendencia, su duración e intensidad, así como a estimar el posible rango de fluctuaciones del precio.
Puede ver de un vistazo en qué dirección se mueve el precio, cuánto dura la tendencia y qué fuerza tiene.
Todo esto convierte al indicador en un sistema de negociación de tendencias fácil de usar, tanto para operadores principiantes como experimentados.
Parámetros
- Período - período promedio para el cálculo del indicador.
- Desviación - desviación del indicador.
- Lag - base de cálculo (número de barras).
Números del buffer del indicador
0 - señal de COMPRA, 1 - señal de VENTA, 2 - nivel superior, 3 - nivel inferior.