Advanced Awesome
- Indicadores
- Versión: 1.0
- Activaciones: 20

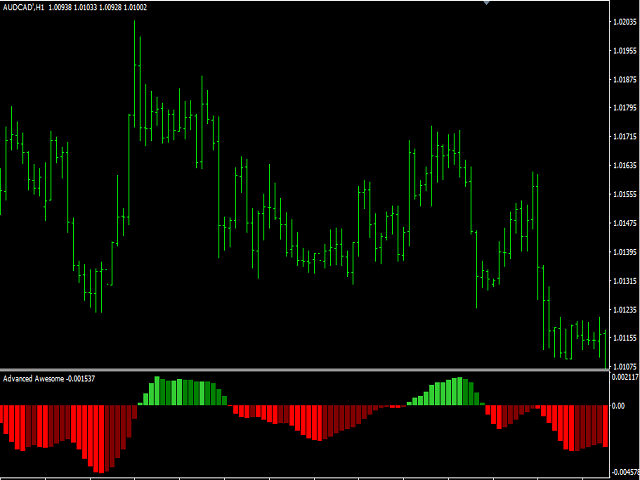
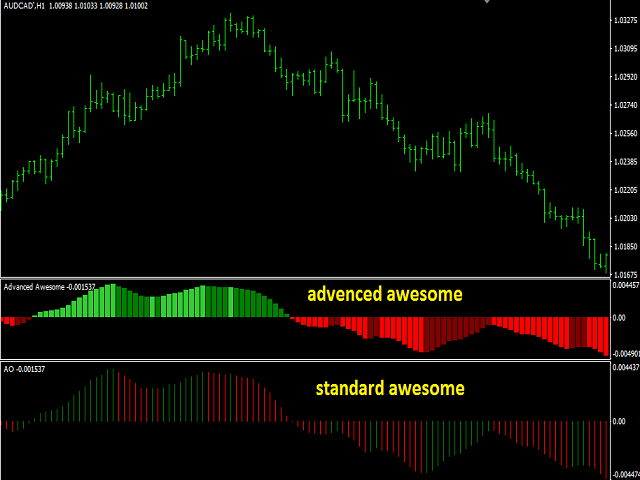
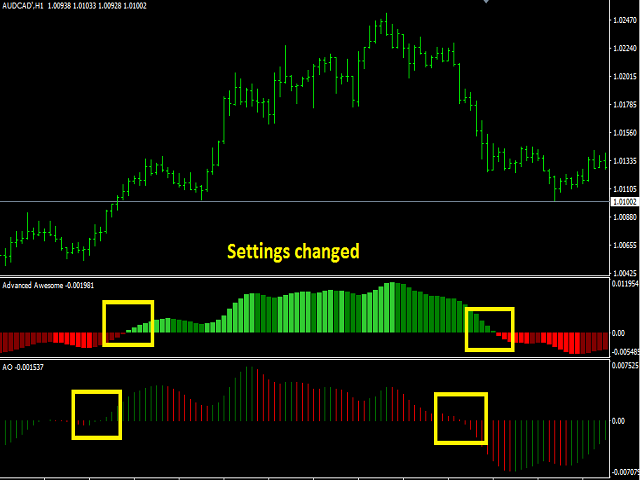
El indicador awesome avanzado es una versión modificada y avanzada del oscilador awesome estándar. Con este indicador ahora puede realizar ajustes que no puede hacer en el indicador awesome.
Puede cambiar y editar este indicador para adaptarlo a su estrategia. Puede utilizarlo fácilmente para reconocer tendencias grandes y pequeñas.
Características
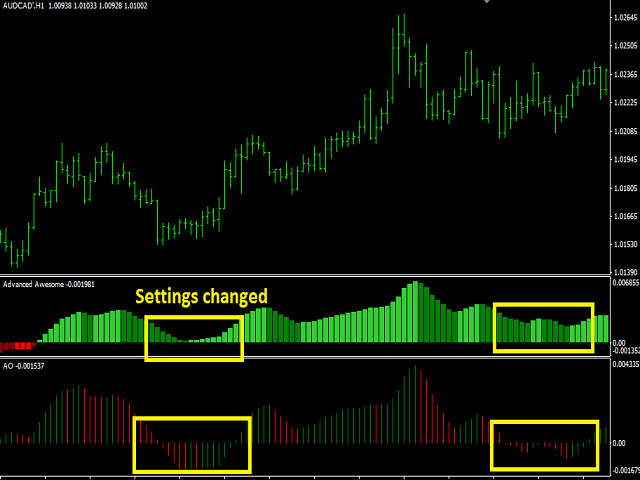
- El periodo puede ser ajustado para definir tendencias más grandes y más pequeñas con la característica de periodo rápido y periodo lento.
- Puede cambiar el modo de entrada con el modo de precio.
- Puede utilizar las propiedades Simple, Exponencial, Suavizada, Lineal Ponderada con la propiedad método MA.
- Puede cambiar el grosor de la barra con la función de peso de línea.
- Puede dar diferentes colores a las tendencias bajistas y alcistas con las características de cambio de color.
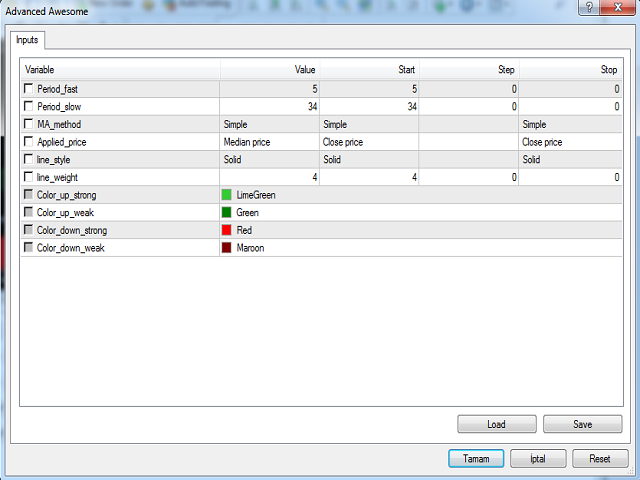
Parámetros
- Period_fast - el periodo rápido.
- Period_slow - el periodo lento.
- MA_method - método de media móvil.
- Applied_price - modo de precio.
- Line_weight - peso del cambio.
- Color_up_strong - color de la tendencia alcista fuerte.
- Color_up_weak - color de tendencia alcista débil.
- Color_down_strong - fuerte tendencia a la baja de color.
- Color_down_weak - color de tendencia bajista débil.