Ejike Currency Basket
- Indicadores
- Versión: 2.0
- Actualizado: 28 noviembre 2021
- Activaciones: 10

Ejike Currency Basket recopila y analiza la fuerza de las divisas y la dinámica de la volatilidad de las 8 divisas principales. Sus datos se formulan a partir de los precios de mercado y la volatilidad. BCE cruza visualmente sus propios informes para generar pares de operaciones de alta probabilidad, cuya elaboración es interactiva para que el operador pueda asumir fácilmente el papel de analista. Su seguimiento en tiempo real de 28 pares implica una comparación constante de sus datos actuales con los pasados. Al ajustar un parámetro, pasará de ser un cuadro de mandos a un indicador utilizado para la entrada de operaciones y la supervisión de las mismas.
Las ventajas:
- enfoque en las operaciones
- datos de precisión presentados en números
- análisis simplificado de datos en tiempo real
- interfaz interactiva de la aplicación y
- capacidad de recuperar datos históricos sin recurrir al Probador de Estrategias.
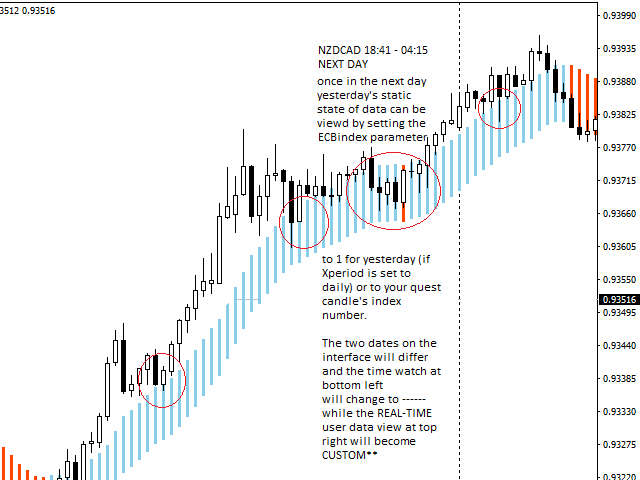
El uso de esta herramienta aporta un enfoque relajado a la negociación de divisas, mejora la confianza del operador, su concentración y la precisión de sus decisiones de negociación. El análisis de datos pasados es posible mediante el uso del Probador de Estrategias para regenerar instantáneas pasadas de los informes o simplemente ajustando el parámetro ECBindex.
Cómo funciona:
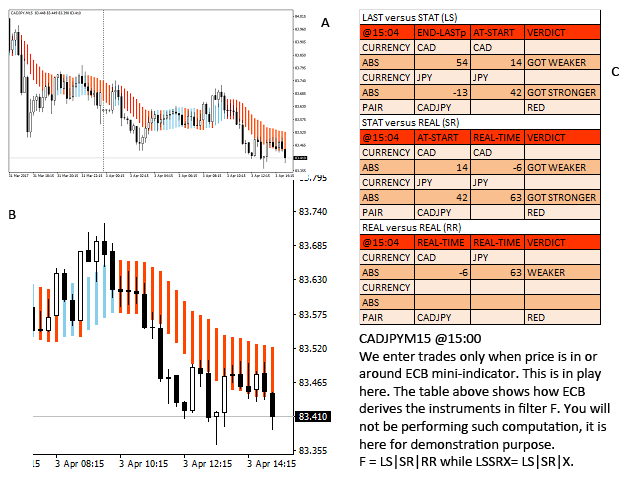
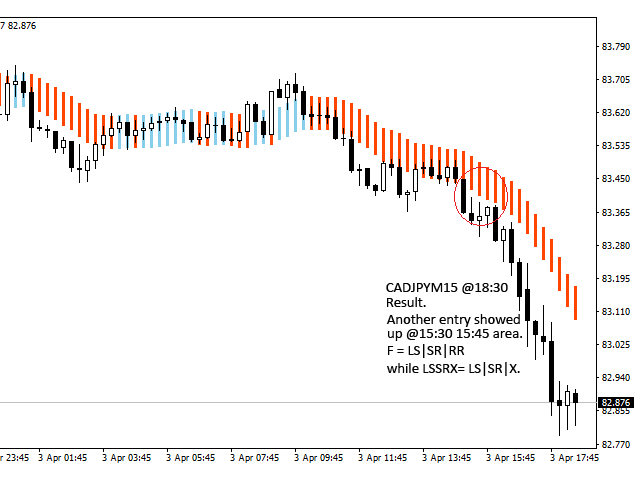
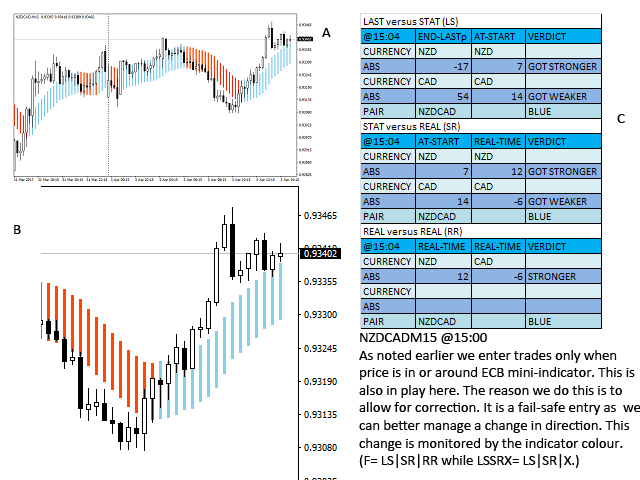
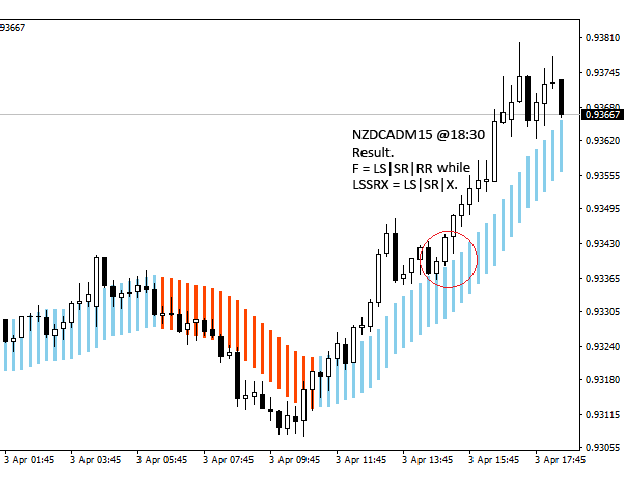
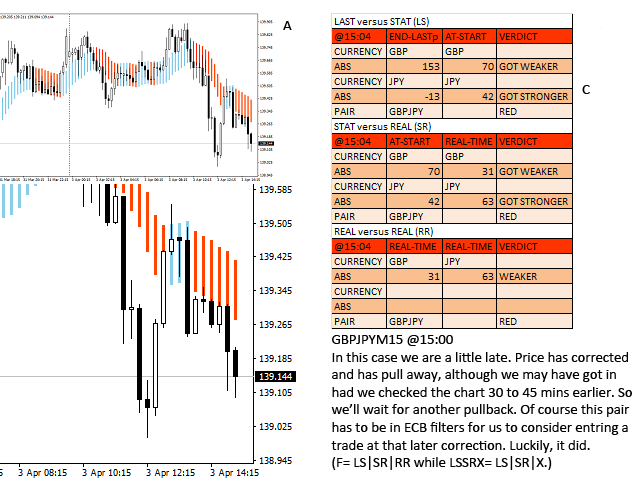
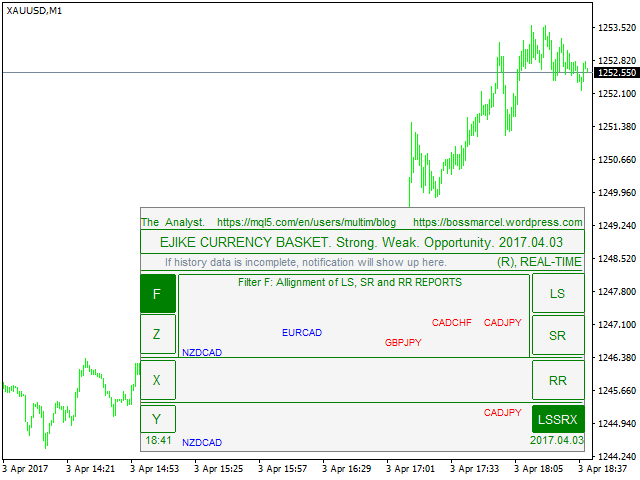
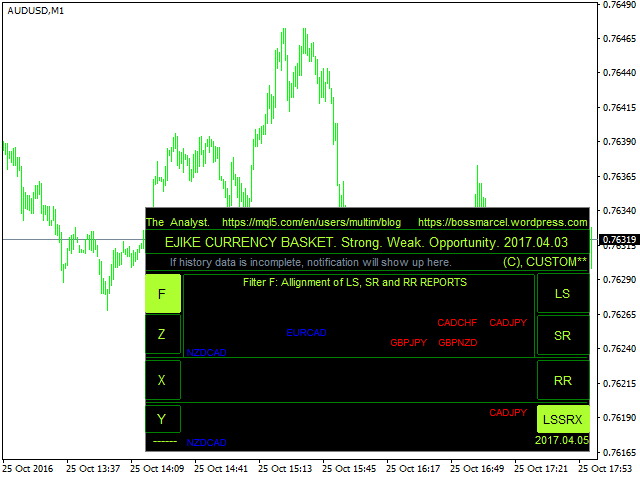
- El robot calcula, sincroniza y cruza las referencias de los informes de las secciones X, Y, Z, LS, SR y RR y, a continuación, publica en los filtros, LSSRX y "F", un resumen de Fortaleza, Debilidad y Oportunidad para operar("SWOT") en los pares de divisas relevantes. Sus sugerencias son fiables.
- El operador observa, confirma y utiliza el indicador ECBmini para introducir y supervisar las operaciones. Esto es fácil en la práctica.
Parámetros del indicador
Los cuatro primeros parámetros de la lista de parámetros son:
- ECBindex: el índice de la vela o de la barra que determina la posición a partir de la cual se realiza el cálculo de la fuerza y los análisis.
- Modo BCE: Dashboard - el modo de funcionamiento de la aplicación, cuando el valor se establece en true la aplicación está en el modo ECB dashboard pero cuando se establece en false la aplicación pasa al modo ECBmini indicator. El cuadro de mandos se utiliza para los análisis, mientras que el indicador se utiliza para la gestión de las operaciones. Se recomienda utilizar el indicador ECBmini en los marcos temporales M15 y M30 si el parámetro Strength Computation Timeframe está establecido en D1.
- Strength Computation Time frame - El marco de tiempo para el cálculo y análisis de la fuerza.
- Enable Automatic Refresh - El valor de true significa que los datos se actualizan automáticamente.
Aparte de los que se muestran externamente, los parámetros cruciales se han optimizado y configurado para funcionar internamente y, por lo tanto, no requieren una configuración adicional mediante entradas externas. Para acceder a la mayor parte de la información del BCE, el operador puede hacer clic en los botones de la interfaz de la aplicación. Cuando el operador decide realizar una operación, el segundo parámetro de la lista de parámetros, "Modo BCE: Dashboard", debe establecerse en false para cambiar al indicador ECBmini que se incluye para ayudar al operador a NO saltar en las operaciones, sino anticipar "puntos dulces" o puntos de entrada. Operar de esta manera garantiza que podamos aplicar el método repetidamente. El operador debe "Habilitar la actualización automática" estableciendo el parámetro en verdadero, de lo contrario deberá pulsar el botón "F" o "LSSRX" para actualizar los datos manualmente.
Operadores nuevos y experimentados
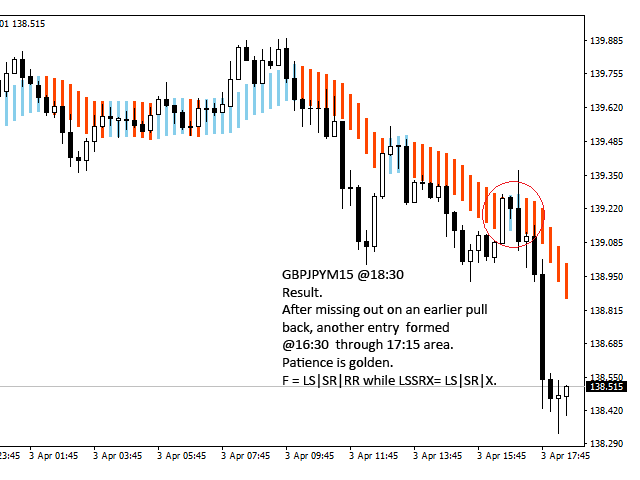
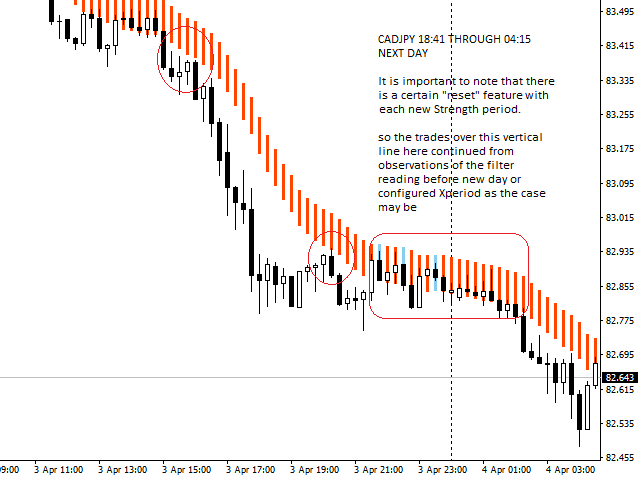
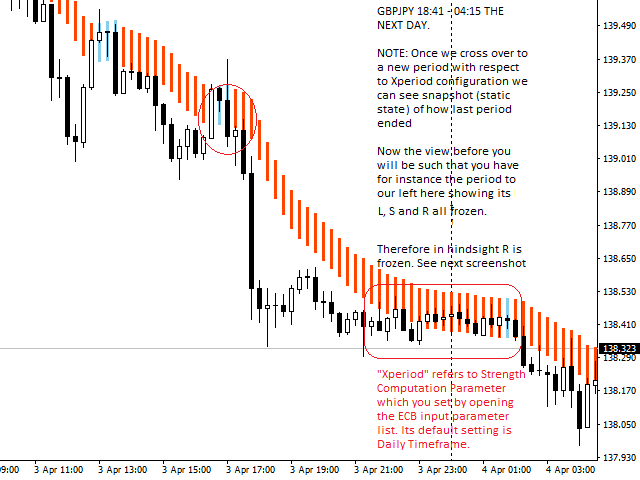
Para los operadores nuevos o inexpertos, o para aquellos que no desean complicarse la vida a la hora de operar, esta herramienta ha sido diseñada para ser utilizada con cualquier nivel de experiencia. Por lo tanto, seleccionar los pares mostrados en LSSRX o "F" para operar y seguir la sencilla regla de entrada puede ser suficiente. Pero, mientras que un operador experimentado ya conoce el poder de un sistema bien formulado de grupos de divisas, un operador nuevo tiene potencial para aprender. Dicho esto, un operador debería combinar los informes de "Y" y "Z" para reforzar los de "F" y LSSRX. Le resultará una tarea fácil, ya que el objetivo del BCE es que las operaciones con divisas sean sencillas y rentables. El informe "Y" muestra la "resistencia" de los pares de divisas, mientras que el informe "Z" muestra la alineación de las fuerzas absolutas (es decir, los números entre paréntesis) ordenadas de izquierda a derecha como "L", "S" y "R". El operador puede utilizar BCE tal y como se describe en las capturas de pantalla de la descripción del producto. Estas son útiles porque los ejemplos en ellas se observaron en vivo el 3 de abril de 2017, desde las 15:04 Alpari Standard3 Server Time hasta las 18:41 del mismo día y por extensión desde las 18:41 hasta las 04:15 del siguiente día de negociación. Haga bien en visitar el blog del desarrollador en mql5.com para más y más ejemplos. Feliz trading.