Modified Bollinger Bands
- Indicadores
-
Gennadiy Stanilevych
 Developments in the field of the "Trading Chaos" strategy involve the use of big data processing technology to generate trading signals and automate order placement based on those signals. All my software products are available on the "Market" page, which can be found at
 - Versión: 6.96
- Actualizado: 4 diciembre 2021
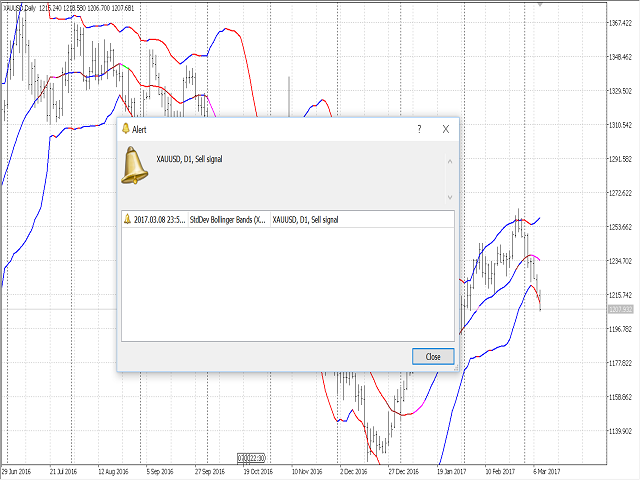
El indicador estándar de las Bandas de Bollinger se ha mejorado integrando indicaciones adicionales del indicador de Desviación Estándar (StdDev), que proporciona un filtro adicional para confirmar las señales de negociación. Además, el color de las líneas del indicador muestra el inicio de una tendencia, su desarrollo y agotamiento. Este indicador dispone de un bloque de señales que notifica al operador el inicio de la tendencia en cualquier marco temporal al que esté vinculado.
Ajustes
- Tipo de mensajes - seleccione el tipo de notificaciones.
- Período de las medias móviles - el período de las medias móviles
- Desplazamiento de barras - desplazamiento de barras
- Desviación de las medias móviles - desviación de las medias móviles
- Tipo de precio - precio aplicado
- Timeframe - marco de tiempo
- Accuracy of price - precisión de los valores
Cómo operar
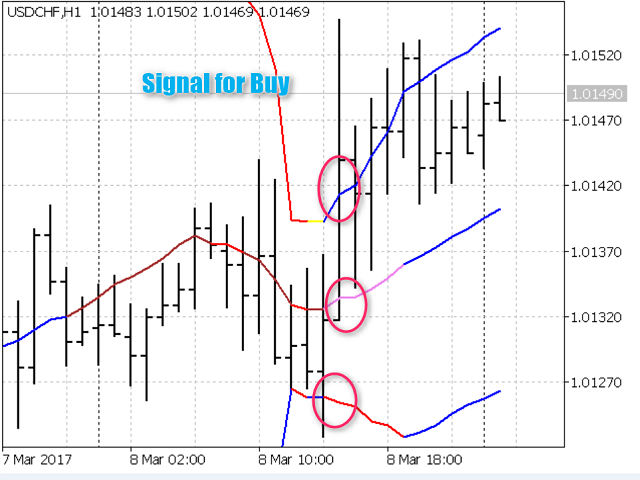
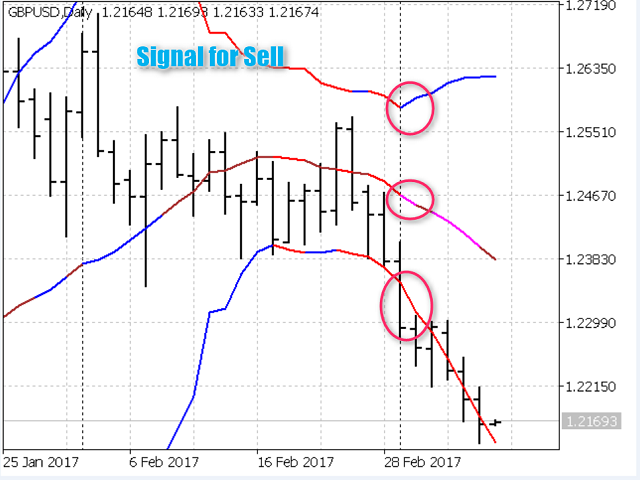
La señal de trading se forma en el momento de ruptura y cierre del precio por encima de la línea superior o por debajo de la línea inferior de las Bandas de Bollinger con apertura simultánea de ambas líneas del indicador. Si hay una ruptura del canal superior de las Bandas de Bollinger - debe ser considerado como un comienzo de una nueva tendencia alcista, si el precio cierra por debajo de la banda inferior, una señal del comienzo de una tendencia bajista. El estrechamiento de la línea superior tras la apertura de una tendencia alcista indica el comienzo del agotamiento del movimiento impulsivo del precio. El crecimiento de la banda superior durante una tendencia bajista indica el agotamiento del movimiento de impulso del precio. Durante un movimiento de tendencia, puede haber varias aceleraciones y agotamiento del impulso. El momento más interesante para empezar a operar es el periodo de cambio de tendencia, y no su última amortiguación en la quinta onda de Elliott.
El indicador es autosuficiente sistema de comercio. Se recomienda utilizarlo como un filtro de señales de comercio en un paquete de software que consta de los siguientes productos:


El usuario no ha dejado ningún comentario para su valoración