DYJ SignalSourceOfRSI
- Indicadores
-
Daying Cao
 ¡Hola! Soy un ingeniero de software ha estado desarrollando durante muchos years.have su propio sistema de comercio único, tiene una riqueza de EA experiencia comercial. La moneda principal es EUR / USD, GBP / USD. USD / JPY, AUD / USD, USD / CAD, oro, EUR / NZD moneda cruzada. EA corriendo para
 - Versión: 1.8
- Actualizado: 26 junio 2024
- Activaciones: 5
DYJ SignalSourceOfRSI es un oscilador de impulso que muestra la fuerza de los precios mediante la comparación de los movimientos al alza de los precios de Cierre con sus movimientos a la baja durante un número seleccionado de períodos.
Hay dos tipos de señales proporcionadas por RSI:
RSI alcanzando ya sea el nivel de sobrecompra o sobreventa y luego haciendo un poco de reversión:
- Las señales de compra se generan cuando el RSI cae por debajo del nivel (30) y las señales de venta se generan cuando el RSI sube por encima del nivel (70).
- La caída del RSI por debajo del nivel(30) y su posterior subida por encima del nivel(30) puede interpretarse como una señal de compra. La subida del RSI por encima del nivel(70) y su posterior bajada por debajo del nivel(70) puede interpretarse como una señal de venta.
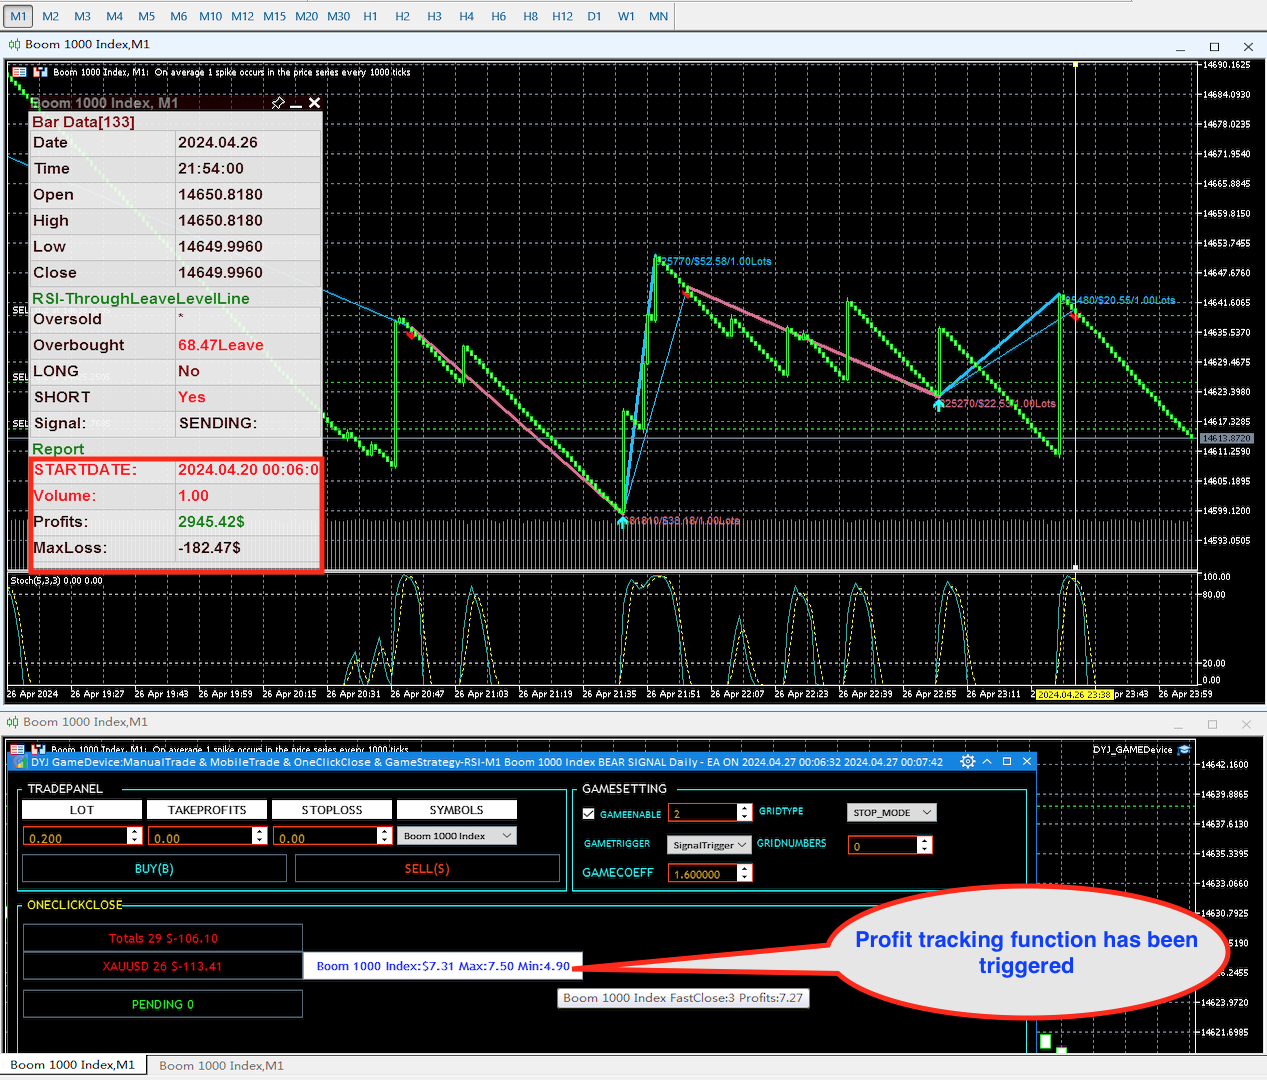
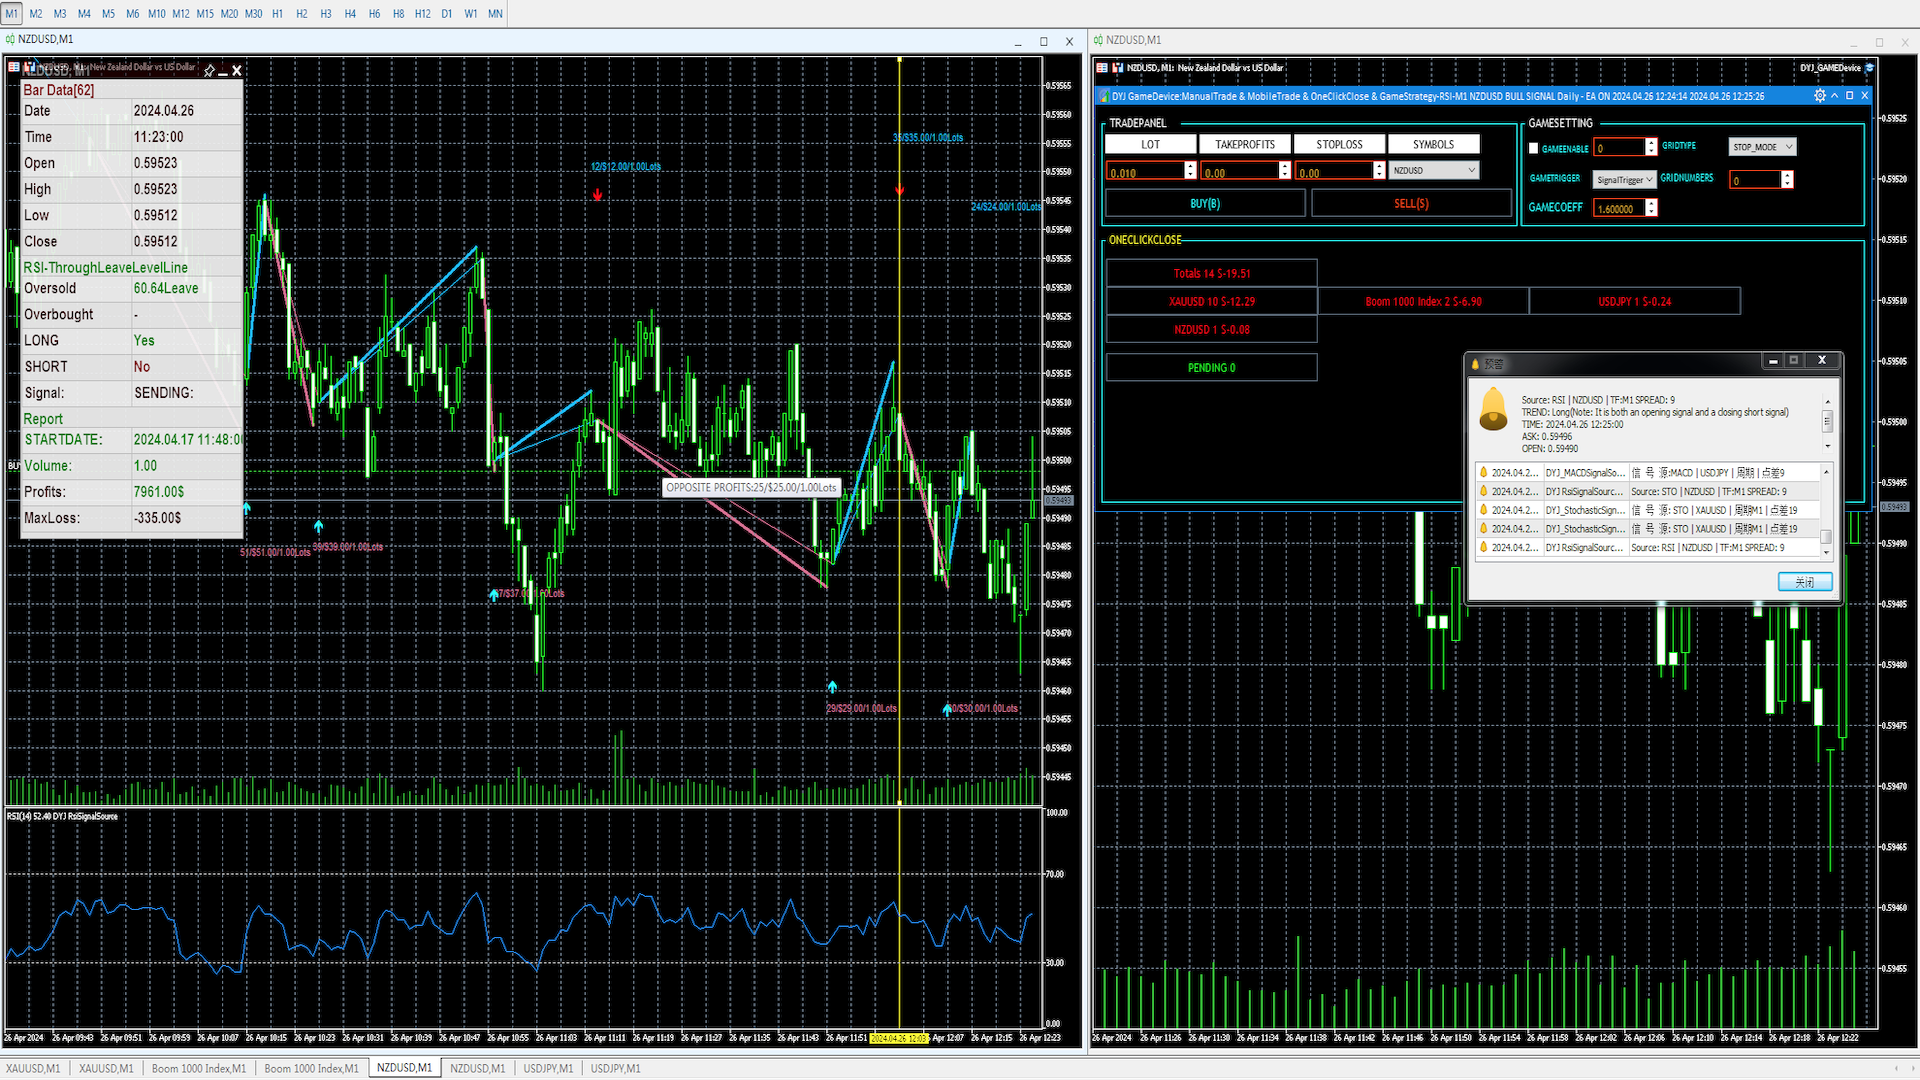
Puede utilizar el modelo de análisis de operaciones del indicador DYJ Mathematical model trader para visualizar las posiciones reales de apertura y cierre de operaciones del indicador y calcular el beneficio global y la pérdida flotante máxima.
Y se envían estas señales de COMPRA y VENTA. Puede utilizar el software de seguimiento DYJ GameDevice para recibir estas señales y realizar la apertura y el cierre automáticos de posiciones. Y puede utilizar la función de estrategia de juego para convertir las órdenes perdedoras en beneficios.
Además, el oscilador DYJ SignalSourceOfRSI también marca el punto de entrada y el punto de salida con flechas de colores, y también cuenta el beneficio total y la pérdida flotante máxima en tiempo real en función de estas posiciones, que son datos importantes para juzgar la probabilidad de negociación.
Entrada
[General]
- InpUseLanguage = Inglés/Chino
- signal_source_name = "RSI"
[Indicador]
- RSIPeriod=14 -- Periodo RSI
- InpOversoldArea = 30 -- zona de sobreventa stoch
- InpOverboughtArea = 70 -- Zona de sobrecompra de stoch
- InpSignalMode = ThroughLeaveLevelLine -- Modo de señal: ThroughEnteyLevelLine / ThroughLeaveLevelLine
- InpSimulatedVolume = 1
- InpOnlyOppositeClosedLine = false
- InpIsDisplayChartText = true
- InpIsDisplayProfitsLine = true
- MaxProfitsTextoAlto = 40
- MaxProfitsTextLow = 20
- UpLineClr = DeepSkyBlue // Color Flecha Arriba
- DnLineClr = PaleVioletRed // Color flecha abajo
- alertsMessage = true
- alertsSound = true
- alertsEmail = false
- alertsPush = false
- InpIsMultipleLinesTextForAlertsMessage = true