Midpoint Bands
- Indicadores
-
Emanuel Cavalcante Amorim Filho
 Not a dev; not a trader. Just a curious.
→ Check out the Emerald EA Builder ⟹ https://www.mql5.com/en/market/product/118373 - Versión: 1.0
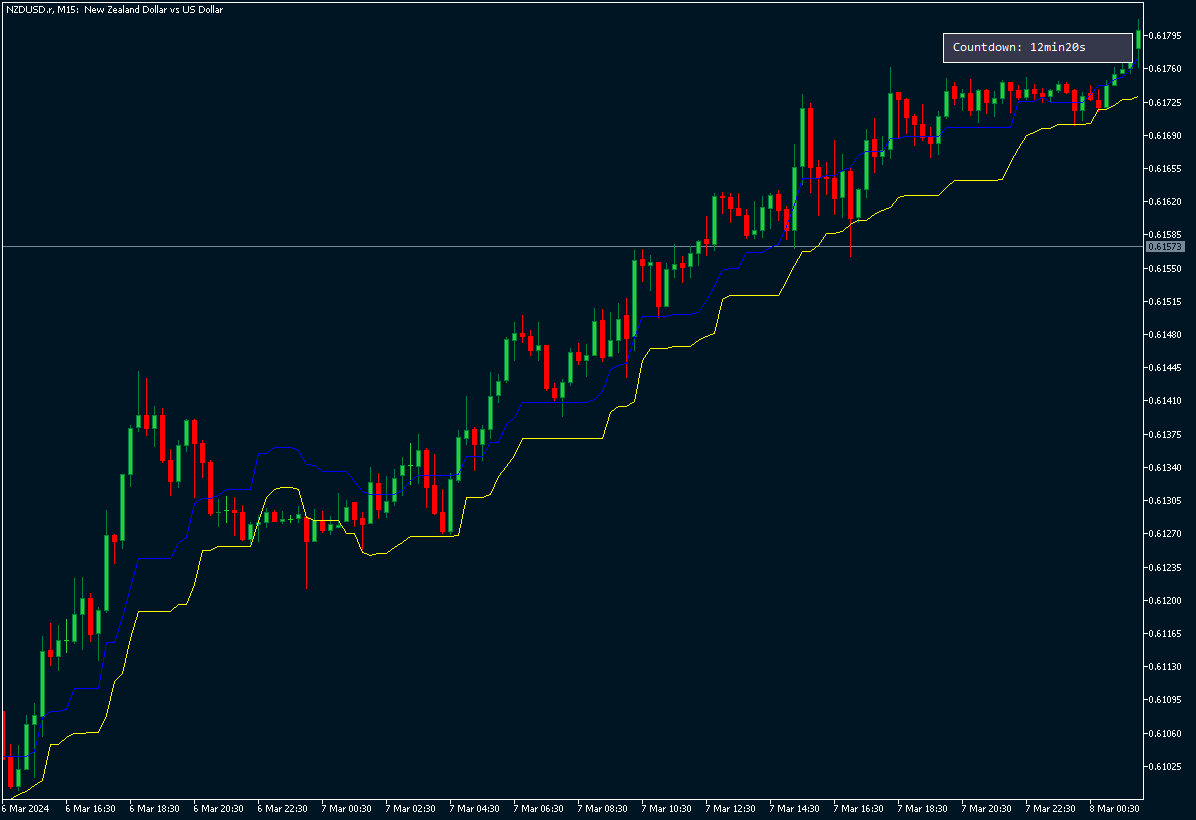
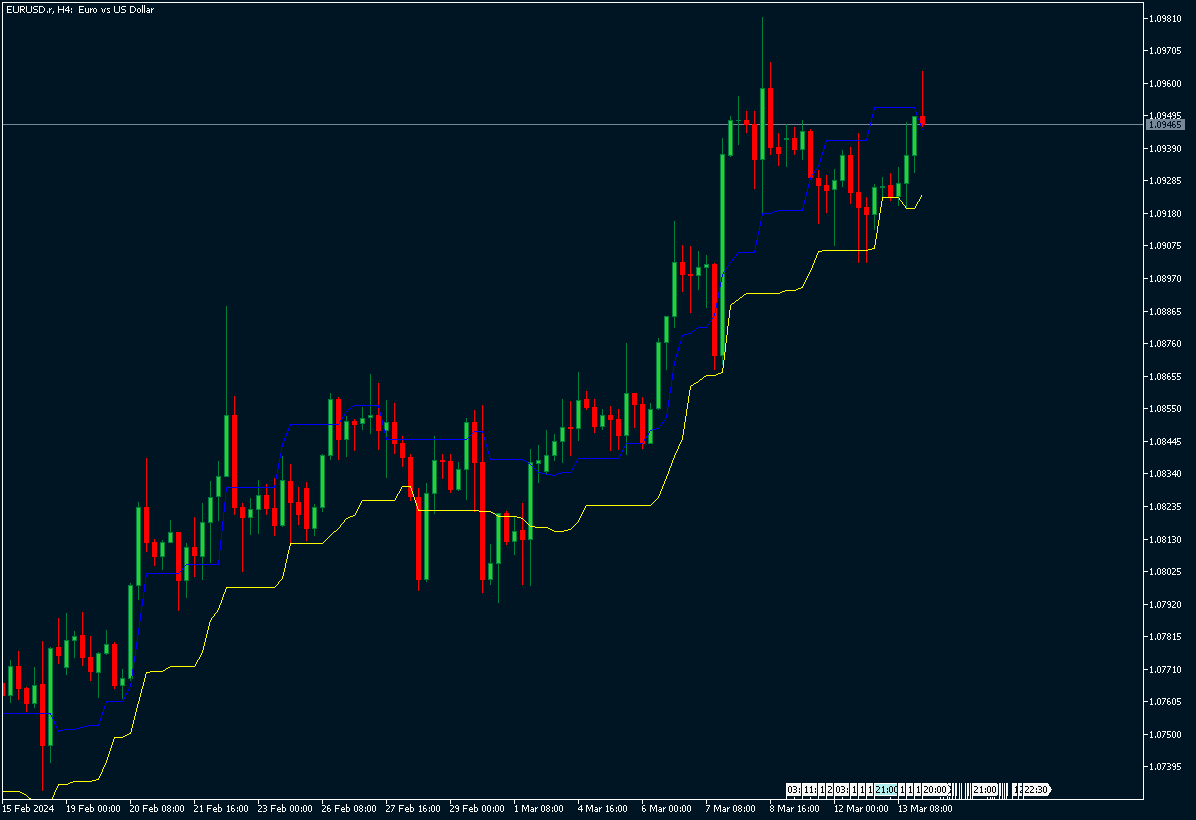
Midpoint Bands es un indicador tipo canal que dibuja dos líneas en el gráfico - una banda superior y una banda inferior, señalando posibles niveles de reversión.
Este es uno de los indicadores utilizados en el Sapphire Strat Maker - EA Builder.
Sapphire Strat Maker - EA Builder: https: //www.mql5.com/en/market/product/113907
Las bandas se calculan de la siguiente manera
Banda superior = (HighestHigh[N-Periods] + LowestHigh[N-Periods])/2
Banda Inferior = (LowestLow[N-Periods] + HighestLow[N-Periods])/2
Línea media = (Banda superior + Banda inferior)/2
Si encuentra algún error, no dude en ponerse en contacto conmigo o dejar un comentario.