• Aperçu
  • Avis (17)
  • Commentaires (35)
  • Nouveautés

BreakEven Line

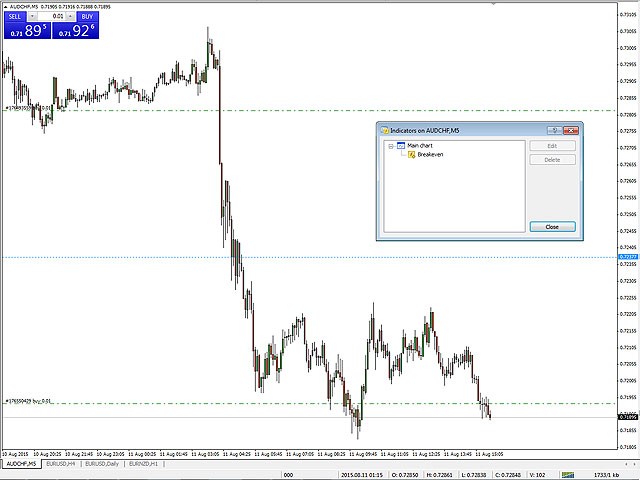
BreakEven Line is a very useful and easy to use indicator.

In case of multiple positions opened on the same instrument, the indicator shows the breakeven point where it is possible to close the positions.

Its graphic simplicity makes it an unobtrusive and customizable tool.

You can enable/disable a line on a chart, so you can make the indicator invisible.
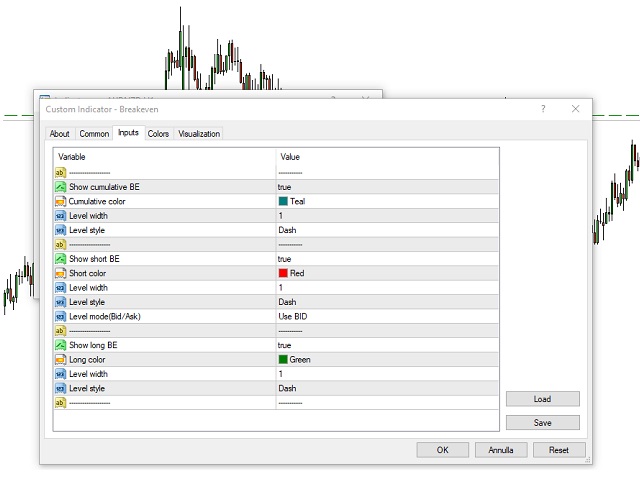
Inputs

  • Show cumulative BE (line on/off)
    • Breakeven line color (to change the line color)
    • Breakeven line style
    • Breakeven line width
  • Show short BE (line on/off)
    • Breakeven line color (to change the line color)
    • Breakeven line style
    • Breakeven line width
  • Show long BE (line on/off)
    • Breakeven line color (to change the line color)
    • Breakeven line style
    • Breakeven line width


Produits recommandés
Owl smart levels
Sergey Ermolov
4.63 (54)
Version MT5  |  FAQ L' indicateur Owl Smart Levels   est un système de trading complet au sein d'un seul indicateur qui comprend des outils d'analyse de marché populaires tels que   les fractales avancées de Bill Williams , Valable ZigZag qui construit   la structure d'onde correcte   du marché et   les niveaux de Fibonacci   qui marquent les niveaux exacts d'entrée. sur le marché et les endroits où prendre des bénéfices. Description détaillée de la stratégie Mode d'emploi de l'indicateur Conse
VR Cub
Vladimir Pastushak
VR Cub est un indicateur permettant d'obtenir des points d'entrée de haute qualité. L'indicateur a été développé pour faciliter les calculs mathématiques et simplifier la recherche de points d'entrée dans un poste. La stratégie de trading pour laquelle l'indicateur a été rédigé prouve son efficacité depuis de nombreuses années. La simplicité de la stratégie de trading est son grand avantage, qui permet même aux traders débutants de négocier avec succès avec elle. VR Cub calcule les points d'ouve
The indicator displays the data of the Stochastic oscillator from a higher timeframe on the chart. The main and signal lines are displayed in a separate window. The stepped response is not smoothed. The indicator is useful for practicing "manual" forex trading strategies, which use the data from several screens with different timeframes of a single symbol. The indicator uses the settings that are identical to the standard ones, and a drop-down list for selecting the timeframe. Indicator Parame
Trendiness Index
Libertas LLC
5 (3)
"The trend is your friend" is one of the best known sayings in investing, because capturing large trendy price movements can be extremely profitable. However, trading with the trend is often easier said than done, because many indicators are based on price reversals not trends. These aren't very effective at identifying trendy periods, or predicting whether trends will continue. We developed the Trendiness Index to help address this problem by indicating the strength and direction of price trend
An indicator of pattern #31 ("Long Island") from Encyclopedia of Chart Patterns by Thomas N. Bulkowski. The second gap is in the opposite direction. Parameters: Alerts - show alert when an arrow appears   Push - send a push notification when an arrow appears (requires configuration in the terminal) GapSize - minimum gap size in points ArrowType - a symbol from 1 to 17 ArrowVShift - vertical shift of arrows in points   ShowLevels - show levels ColUp - color of an upward line ColDn - color of
PW Oscillator
Svyatoslav Kucher
PW Oscillator   - индикатор предназначенный для поиска локальных экстремумов, определения текущей тенденции. В расчетах индикатора используется авторская методика. С помощью индикатора можно определять места возможного разворота цены желательно в направлении тенденции, но также с достаточной точностью и против нее. Также с помощью индикатора можно определять текущую тенденцию. Индикатор подходит для любых валютных пар, но для адекватного отображения показания необходимо, чтобы было достаточно ис
Laguerre SuperTrend Clouds adds an Adaptive Laguerre averaging algorithm and alerts to the widely popular SuperTrend indicator. As the name suggests, Laguerre SuperTrend Clouds (LSC) is a trending indicator which works best in trendy (not choppy) markets. The SuperTrend is an extremely popular indicator for intraday and daily trading, and can be used on any timeframe. Incorporating Laguerre's equation to this can facilitate more robust trend detection and smoother filters. The LSC uses the impro
Wave Wolf MT4
Andrei Salanevich
L'indicateur Forex Wave Wold MT4 est conçu pour rechercher les vagues de Woolf et les afficher dans la fenêtre actuelle du terminal de trading. Un excellent indicateur pour les traders utilisant les vagues de Wolf dans le commerce. Son application dans les stratégies de trading augmentera considérablement leur efficacité et leur rentabilité. INFORMATIONS SUR L'INDICATEUR Contrairement à d'autres indicateurs de vague Wold, l'indicateur Forex Wave Wold MT4 a un certain nombre de caractéristique
Power Renko is an indicator which plots Renko bricks underneath the chart using a histogram. You can select the brick size and the timeframe of the Renko bricks as well as whether or not to use the close price or the high/low price of the candles. Renko bricks are based on price alone, not time, therefor the Renko bricks will not be aligned with the chart's time. They are extremely useful for trend trading and many different strategies can be formed from them. Buffers are provided allowing you t
Trade with Gann on your side!! MASTER CIRCLE 360 CIRCLE CHART, originally created by Gann admitted that this is “The Mother of all charts”. It is one of the last studies that this great trader left for us. The numeric tab le is apparently quite simple like all the tables and is based on square numbers, the SQUARE OF 12 and is by evolution, one of the most important square numbers. Here we can find CYCLE, PRICE AND TIME thanks to angles and grades, to show past and future support and resistance.
Line Magnit
Aleksey Trenin
The LineMagnit Indicator for MT4 is a highly precise tool that builds support and resistance levels which magnetically attract prices. This feature allows traders to easily determine the most probable entry and exit points in the market, as well as identify the market's directional forces, as levels are based on capital inflows into the instrument. Equipped with an intuitively understandable graphical interface, the LineMagnit Indicator enables users to quickly locate and analyze support and res
L'indicateur calcule et trace automatiquement les niveaux de support et de résistance de Fibonacci - l'un des outils les plus efficaces pour l'analyse de marché. Le calcul utilise les données de prix moyennes pour la période et la période sélectionnées. Le minimum et le maximum pour cette période sont considérés comme le début et la fin du mouvement. Les niveaux de Fibonacci vous permettent de voir des points de référence potentiels, autour desquels le mouvement des prix peut ralentir ou s'inver
Noize Absorption Index MT4
Ekaterina Saltykova
5 (1)
Noize Absorption Index - is the manual trading system that measures the difference of pressure between bears forces and bulls forces. Green line - is a noize free index that showing curent situation. Zero value of index shows totally choppy/flat market.Values above zero level shows how powerfull bullish wave is and values below zero measures bearish forces.Up arrow appears on bearish market when it's ready to reverse, dn arrow appears on weak bullish market, as a result of reverse expectation. S
PipFinite Trend PRO
Karlo Wilson Vendiola
4.9 (2775)
Breakthrough Solution For Trend Trading And Filtering With All Important Features Built Inside One Tool! Trend PRO's smart algorithm detects the trend, filters out market noise and gives entry signals with exit levels. The new features with enhanced rules for statistical calculation improved the overall performance of this indicator. Important Information Revealed Maximize the potential of Trend Pro, please visit www.mql5.com/en/blogs/post/713938 The Powerful Expert Advisor Version Automa
The indicator detects and displays 3 Drives harmonic pattern (see the screenshot). The pattern is plotted by the extreme values of the ZigZag indicator (included in the resources, no need to install). After detecting the pattern, the indicator notifies of that by a pop-up window, a mobile notification and an email. The indicator highlights the process of the pattern formation and not just the complete pattern. In the former case, it is displayed in the contour triangles. After the pattern is com
Trend Ray
Andriy Sydoruk
The indicator shows the potential trend direction by cyclical-wave dependence. Thus, all the rays of the intersection will be optimal rays, in the direction of which the price is expected to move, taking into account the indicator period. Rays can be used as a direction for potential market movement. But we must not forget that the approach must be comprehensive, the indicator signals require additional information to enter the market.
Trend Scanner
Vladimir Kalendzhyan
4.38 (8)
By purchasing this indicator, you have the right to receive a free copy of one of   my other indicator's or advisor’s!  (All future updates are included. No limits) . To get it , please contact me by  mql5 message ! The Trend Scanner trend line indicator displays the trend direction and its changes. The indicator works on all currency pairs and  timeframes. The indicator simultaneously displays multiple readings on the price chart: the support and resistance lines of the currency pair, the exist
Title : Market Bias Indicator - Oscillator-Based Trading Tool Introduction : Discover the potential of the "Market Bias Indicator," a revolutionary oscillator-based trading tool designed for precise market analysis. If you're in search of a robust alternative to traditional bias indicators, your quest ends here. Market Bias Indicator offers unparalleled accuracy in identifying market sentiment and is your gateway to confident trading decisions. Recommended Trading Pairs : Market Bias Indicator i
Commodity Channel Index Message is an indicator for the MetaTrader 4 trading platform. Unlike the original indicator, this three in one version has a system of alerts that inform on market situation changes. It consists of the following signals: when the Main line crosses the levels of extreme zones and 50% level; when the Main line crosses the Trend line in the indicator window; Divergence on the last bar. Values of the middle and extreme levels and divergence zones are customizable. Paramete
Super Gator
Agustinus Biotamalo Lumbantoruan
This indi shows the following 1. Supertrend 2. Alligator (Not a regular alligator) 3. ZigZag 4. Moving Average 5. Trend Continuation/Mini correction Signal (plotted in X) (See screenshots in green background color 6. Early Signal Detection (See screenshots in green background color) You may treat Alligator as the lagging indicator The leading indicator is the supertrend. The zig zag is based on the leading indicator where it gets plotted when the leading indicator got broken to the opposite.
You can change the time period of the chart at the touch of a button. You can also change multiple charts at the touch of a button. You can also change multiple charts at the touch of a button, saving you the trouble of changing time periods. We are live-streaming the actual operation of the system. https://www.youtube.com/@ganesha_forex We do not guarantee your investment results. Investments should be made at your own risk. We sharll not be liable for any disadvantage or damage caused by
Magic Filter MTF
Yaroslav Varankin
4 (1)
Magic Filter MTF is perfect for any strategy. you do not need to load the chart with extra indicators like this one indicator will replace all additional filters for you it can also be a great strategy. it combines well with trading at local minima and maximums (resistance levels) multi-timeframe-multi-currency indicator 4 screen system is used 4 rows of arrows UTB indicators adjusted for different periods when two arrows pointing in the same direction on the same timeframe coincide
What are Heiken Ashi Candles? Heiken Ashi, derived from the Japanese term 'Heikin Ashi,' translates to average price bars. It's an indicator depicting price bars on a chart. Formula for Heiken Ashi candles: - Heiken Ashi opening price: (previous candle's opening + closing price) / 2 - Closing price Heiken Ashi: (opening + high + low + closing) / 4 - Heiken Ashi peak: Max of high, opening, or closing price - Heiken Ashi bottom price: Min of low, opening, or closing price How to Read Heik
FreqoMaster
Stanislav Korotky
The main idea of this indicator is rates analysis and prediction by Fourier transform. The indicator decomposes exchange rates into main harmonics and calculates their product in future. The indicator shows 2 price marks in history, depicting price range in the past, and 2 price marks in future with price movement forecast. Buy or sell decision and take profit size are displayed in a text label in the indicator window. The indicator uses another indicator as an engine for calculations - FreqoMet
Now, you have your own AUTO-CLOSE program ! Once your account target or drawdown hits, all open orders will be closed automatically. ========================================== INPUTS: Account target: Put the exact account target. Once the equity hits it or went above that, all orders closed. Please add buffer to consider slippage. Use fixed value or dynamic value: Choose whether you will need a fixed value or dynamic value for drawdown.  DYNAMIC SETTINGS: Equity-based or Balance-based drawdown:
Forex Indicator  " Morning  Star  pattern" for MT4 Indicator "Morning Star pattern" is a very powerful indicator for Price Action trading:    No repaint, No delays; Indicator   detects bullish Morning Star patterns on chart:  Blue arrow signal on chart (see pictures) P C, Mobile & Email alerts   are included Also its brother - bearish  " Evening Star pattern" indicator is available (follow the links below) Indicator  " Morning Star pattern"  is excellent to   combine with Support/Resistance Leve
Golden Hunter MT4
Rodrigo Arana Garcia
4 (4)
DERNIER COPIE A 75$ ---> Suivant : 99$ !!!  Version MT5 Golden Hunter a été développé pour les traders qui négocient manuellement sur les marchés. Il s'agit d'un outil très puissant composé de 3 indicateurs différents : Stratégie d'entrée puissante : Formée par un indicateur qui mesure la volatilité de la paire de devises et identifie la tendance du marché. LSMA : Lisse les données de prix et est utile pour détecter la tendance à court terme. Heikin Ashi : Une fois l'indicateur attaché au graph
Candlestick Patterns Analytics is a powerful tool for analyzing candlestick patterns. Do you trade based on candlestick patterns? Then Candlestick Patterns Analytics is designed for you. The undeniable advantage of the indicator: Predicts trading result when trading candlestick patterns; Uses statistical data based on the history of the selected symbol and timeframe. What the indicator does Finds and marks on the chart 29 candlestick patterns; Draws arrows to indicate the classical and stati
Point61 Indicator
Evgeniy Machok
5 (1)
The Point61 indicator is the result of many years of monitoring of price behavior of currency pairs and metals. It is not a secret, that in times of uncertainty, traders are looking for possible levels of support and resistance - the point, where price should stop its movement. There are 2 possible scenarios at these points: 1. Reverse (correction) to the opposite direction; 2. Breakthrough to continue movement. Very often these points are used to set stop orders - TakeProfit or
Master Scalping M1 est un indicateur innovant qui utilise un algorithme pour déterminer rapidement et avec précision la tendance. L'indicateur calcule le temps d'ouverture et de fermeture des positions, les algorithmes de l'indicateur vous permettent de trouver les moments idéaux pour entrer dans une transaction (acheter ou vendre un actif), ce qui augmente le succès des transactions pour la plupart des commerçants. Avantages de l'indicateur : Facile à utiliser, ne surcharge pas le graphique ave
Les acheteurs de ce produit ont également acheté
Gann Made Easy
Oleg Rodin
4.96 (47)
Gann Made Easy est un système de trading Forex professionnel et facile à utiliser qui est basé sur les meilleurs principes de trading en utilisant la théorie de mr. WD Gann. L'indicateur fournit des signaux d'ACHAT et de VENTE précis, y compris les niveaux Stop Loss et Take Profit. Vous pouvez échanger même en déplacement en utilisant les notifications PUSH. S'il vous plaît contactez-moi après l'achat! Je partagerai avec vous mes astuces de trading et d'excellents indicateurs bonus gratuitement!
Atomic Analyst
Issam Kassas
5 (1)
Tout d'abord, il convient de souligner que cet indicateur de trading n'est ni repainting, ni redrawing et ne présente aucun délai, ce qui le rend idéal à la fois pour le trading manuel et automatisé. L'Analyste Atomique est un indicateur d'action sur les prix PA qui utilise la force et le momentum du prix pour trouver un meilleur avantage sur le marché. Équipé de filtres avancés qui aident à éliminer les bruits et les faux signaux, et à augmenter le potentiel de trading. En utilisant plusieur
ACTUELLEMENT 26% DE RÉDUCTION La meilleure solution pour tout débutant ou trader expert ! Cet indicateur est un outil de trading unique, de haute qualité et abordable car nous avons incorporé un certain nombre de caractéristiques exclusives et une nouvelle formule. Avec seulement UN graphique, vous pouvez lire la force de la devise pour 28 paires Forex ! Imaginez comment votre trading va s'améliorer parce que vous êtes capable de repérer le point de déclenchement exact d'une nouvelle tendan
Tout d'abord, il convient de souligner que cet outil de trading est un indicateur non repeint, non redessiné et non retardé, ce qui le rend idéal pour le trading professionnel. L'indicateur Smart Price Action Concepts est un outil très puissant à la fois pour les nouveaux et les traders expérimentés. Il regroupe plus de 20 indicateurs utiles en un seul, combinant des idées de trading avancées telles que l'analyse du trader Inner Circle et les stratégies de trading Smart Money Concepts. Cet in
Scalper Vault
Oleg Rodin
5 (27)
Scalper Vault est un système de scalpage professionnel qui vous fournit tout ce dont vous avez besoin pour un scalpage réussi. Cet indicateur est un système de trading complet qui peut être utilisé par les traders de forex et d'options binaires. Le délai recommandé est M5. Le système vous fournit des signaux fléchés précis dans le sens de la tendance. Il vous fournit également des signaux supérieurs et inférieurs et des niveaux de marché Gann. Les indicateurs fournissent tous les types d'alertes
TPSproTREND PrO
Roman Podpora
5 (15)
TPSpro TRENDPRO  - is a trend indicator that automatically analyzes the market and provides information about the trend and each of its changes, as well as giving signals for entering trades without redrawing! The indicator uses each candle, analyzing them separately. referring to different impulses - up or down impulse. Exact entry points into transactions for currencies, crypto, metals, stocks, indices!  -  Version MT5               DETAILED DESCRIPTION        /       TRADING SETUPS           
Trend Screener
STE S.S.COMPANY
4.83 (86)
Indicateur de tendance, solution unique révolutionnaire pour le trading et le filtrage des tendances avec toutes les fonctionnalités de tendance importantes intégrées dans un seul outil ! Il s'agit d'un indicateur multi-période et multi-devises 100 % non repeint qui peut être utilisé sur tous les symboles/instruments : forex, matières premières, crypto-monnaies, indices et actions. Trend Screener est un indicateur de suivi de tendance efficace qui fournit des signaux de tendance fléchés avec des
Actuellement 20% de réduction ! La meilleure solution pour tout débutant ou trader expert ! Ce logiciel de tableau de bord fonctionne sur 28 paires de devises. Il est basé sur 2 de nos principaux indicateurs (Advanced Currency Strength 28 et Advanced Currency Impulse). Il donne un excellent aperçu de l'ensemble du marché Forex. Il montre les valeurs de l'Advanced Currency Strength, la vitesse de mouvement des devises et les signaux pour 28 paires de devises dans tous les (9) délais. Imagine
Scalper Inside PRO
Alexey Minkov
4.75 (55)
SALE NOW! Limited Time Offer! An exclusive indicator that utilizes an innovative algorithm to swiftly and accurately determine the market trend. The indicator automatically calculates opening, closing, and profit levels, providing detailed trading statistics. With these features, you can choose the most appropriate trading instrument for the current market conditions. Additionally, you can easily integrate your own arrow indicators into Scalper Inside Pro to quickly evaluate their statistics and
Le profit de la structure du marché change à mesure que le prix s'inverse et recule. L'indicateur d'alerte d'inversion de la structure du marché identifie le moment où une tendance ou un mouvement de prix approche de l'épuisement et est prêt à s'inverser. Il vous avertit des changements dans la structure du marché qui se produisent généralement lorsqu'un renversement ou un recul majeur est sur le point de se produire. L'indicateur identifie initialement les cassures et la dynamique des prix,
TPSpro RFI Levels
Roman Podpora
5 (13)
A key element in trading is zones or levels from which decisions to buy or sell a trading instrument are made. Despite attempts by major players to conceal their presence in the market, they inevitably leave traces. Our task was to learn how to identify these traces and interpret them correctly. Reversal First Impulse levels (RFI)   -  Version MT5                INSTRUCTIONS                 RUS                 ENG                                       R ecommended to use with an indicator   -  
Présentation       Quantum Trend Sniper Indicator   , l'indicateur révolutionnaire MQL5 qui transforme la façon dont vous identifiez et négociez les inversions de tendance ! Développé par une équipe de traders expérimentés avec une expérience commerciale de plus de 13 ans,       Indicateur Quantum Trend Sniper       est conçu pour propulser votre parcours de trading vers de nouveaux sommets grâce à sa manière innovante d'identifier les inversions de tendance avec une précision extrêmement élevée
Quantum Breakout Indicator PRO
Bogdan Ion Puscasu
4.96 (26)
Présentation       Quantum Breakout PRO   , l'indicateur révolutionnaire MQL5 qui transforme la façon dont vous négociez les zones d'évasion ! Développé par une équipe de traders expérimentés avec une expérience de trading de plus de 13 ans,   Quantum Breakout PRO   est conçu pour propulser votre parcours de trading vers de nouveaux sommets grâce à sa stratégie de zone de discussion innovante et dynamique. Quantum Breakout Indicator vous donnera des flèches de signalisation sur les zones d
Advanced Supply Demand
Bernhard Schweigert
4.92 (310)
CURRENTLY 26% OFF !! Best Solution for any Newbie or Expert Trader! This indicator is a unique, high quality and affordable trading tool because we have incorporated a number of proprietary features and a new formula. With this update, you will be able to show double timeframe zones. You will not only be able to show a higher TF but to show both, the chart TF, PLUS the higher TF: SHOWING NESTED ZONES. All Supply Demand traders will love it. :) Important Information Revealed Maximize the potenti
Découvrez le secret pour réussir le trading Forex avec notre indicateur MT4 personnalisé! Vous êtes-vous déjà demandé comment réussir sur le marché du Forex, gagnant régulièrement des bénéfices tout en minimisant les risques? Voici la réponse que vous avez recherchée! Permettez-nous d'introduire notre indicateur MT4 propriétaire qui révolutionnera votre approche du trading. Polyvalence unique Notre indicateur est spécialement conçu pour les utilisateurs qui préfèrent les formations de bou
Présentation de l'indicateur miraculeux Forex : Libérez la puissance du trading précis En avez-vous assez de chercher le meilleur indicateur Forex qui fournisse réellement des résultats exceptionnels sur tous les délais ? Ne cherchez plus ! L'indicateur miraculeux Forex est là pour révolutionner votre expérience de trading et propulser vos gains vers de nouveaux sommets. Basé sur une technologie de pointe et des années de développement minutieux, l'indicateur miraculeux Forex se positionne comme
Break and Retest
Mohamed Hassan
5 (2)
Break & Retest is unstoppable when combined with our other divergence indicator. After purchase, send us a message and you could get this  2nd indicator  for  FREE  as a  BONUS! ‍You can visually backtest Break & Retest to see how it behaved in the past!    Manual guide:   Click here $59  for the first 25 copies ( 4  left)! Next price is $120 .  After many months of hard work and dedication, we are extremely proud to present you our  Break and Retest price action indicator crea
Entry Points Pro
Yury Orlov
4.7 (225)
Indicateur supérieur pour MT4 fournissant des signaux précis pour entrer dans un trade sans repeindre ! Il peut être appliqué à tous les actifs financiers : forex, cryptocurrencies, métaux, actions, indices.  La version MT5 est ici Il fournira des signaux de trading assez précis et vous dira quand il est préférable d'ouvrir un trade et de le fermer. Regardez la vidéo (6:22) avec un exemple de traitement d'un seul signal qui a rapporté à l'indicateur ! La plupart des traders améliorent l
Currency Strength Wizard est un indicateur très puissant qui vous offre une solution tout-en-un pour un trading réussi. L'indicateur calcule la puissance de telle ou telle paire de devises en utilisant les données de toutes les devises sur plusieurs périodes. Ces données sont représentées sous la forme d'un indice de devise facile à utiliser et de lignes électriques de devise que vous pouvez utiliser pour voir la puissance de telle ou telle devise. Tout ce dont vous avez besoin est d'attacher l'
TrendMaestro
Stefano Frisetti
5 (2)
note: this indicator is for METATRADER4, if you want the version for METATRADER5 this is the link: TRENDMAESTRO recognizes a new TREND in the bud, he never makes mistakes. The certainty of identifying a new TREND is priceless. DESCRIPTION TRENDMAESTRO identifies a new TREND in the bud, this indicator examines the volatility, volumes and momentum to identify the moment in which there is an explosion of one or more of these data and therefore the moment in which prices have strong probability of f
TrendDecoder Premium
Christophe, Pa Trouillas
5 (3)
Identifiez les ranges et les prochaines tendances fortes   |  Obtenez les premiers signaux et la force des tendances   |  Obtenez des TP clairs et RR favorable   |  Repérer les niveaux Fibo que le prix va tester Indicateur qui ne retrace pas, non retardé - idéal pour le trading manuel et automatisé - adapté à tous les actifs et à toutes les unités de temps Pour une durée limitée >>   -50% de réduction Après votre achat,   contactez-moi sur ce canal  pour obtenir les réglages recommandés. Version
ALERTE D'ACHAT ET DE VENTE MULTIDEVISES et MULTITIMEFRAME. AUTO TRAILING STOP ET RÉCOMPENSE DE RISQUE TAKEPROFIT ! L'INDICATEUR SCANNE ET ANALISE LE MARCHÉ POUR QUE VOUS N'AVEZ RIEN À FAIRE ! NÉGOCIEZ TOUTES VOS DEVISES SUR UN GRAPHIQUE !   Après l'achat veuillez laisser un commentaire, contactez-moi et je vous enverrai l'assistant commercial EA. L'indicateur utilise plusieurs oscillateurs et filtres associés pour trouver les meilleurs points d'entrée CONFIRMÉS afin que vous n'ayez pas à
FX Power MT4 NG
Daniel Stein
5 (8)
Obtenez votre mise à jour quotidienne du marché avec des détails et des captures d'écran via notre Morning Briefing ici sur mql5 et sur Telegram ! FX Power MT4 NG est la nouvelle génération de notre très populaire indicateur de force des devises, FX Power. Et qu'est-ce que ce compteur de force de nouvelle génération offre ? Tout ce que vous avez aimé de l'original FX Power PLUS Analyse de la force de l'OR/XAU Des résultats de calcul encore plus précis Périodes d'analyse configurables individuel
Trend Forecasting
Mohamed Hassan
5 (15)
Cet indicateur est très puissant lorsqu'il est combiné avec notre autre indicateur appelé Katana. Après l'achat, envoyez-nous un message et vous pourrez obtenir Katana GRATUITEMENT en BONUS  ! Le prix augmentera bientôt à 149$ ! Ne manquez pas le prix courant à 65$ ! L'indicateur de prévision de tendance est un outil très unique et simple qui est capable de prédire les mouvements futurs des prix en fonction des signaux générés par MACD. Cela vous aide à avoir une estimation des domaines dans
Price Action Entry Alerts
Stephen Sanjeeve Sahayam
5 (3)
Cet indicateur examine chaque barre pour la pression d'achat ou de vente et identifie 4 types de modèles de bougies avec le volume le plus élevé. Ces bougies sont ensuite filtrées à l'aide de plusieurs filtres linéaires pour afficher les signaux d'achat ou de vente. Les signaux fonctionnent mieux, en conjonction avec une direction temporelle plus élevée et lorsqu'ils sont négociés pendant les heures de volume élevé. Tous les filtres sont personnalisables et fonctionnent indépendamment. Peut aff
ACTUELLEMENT 31% DE RÉDUCTION ! ! La meilleure solution pour tout débutant ou Expert Trader ! Cet indicateur est un outil de trading unique, de haute qualité et abordable car nous avons incorporé un certain nombre de caractéristiques exclusives et une formule secrète. Avec seulement UN graphique, il donne des alertes pour les 28 paires de devises. Imaginez comment votre trading s'améliorera parce que vous serez capable de repérer le point de déclenchement exact d'une nouvelle tendance ou d'
FX Volume
Daniel Stein
4.6 (35)
Obtenez votre mise à jour quotidienne du marché avec des détails et des captures d'écran via notre Morning Briefing ici sur mql5 et sur Telegram ! FX Volume est le PREMIER et SEUL indicateur de volume qui fournit un VRAI aperçu du sentiment du marché du point de vue d'un courtier. Il fournit des informations impressionnantes sur la façon dont les acteurs institutionnels du marché, comme les courtiers, sont positionnés sur le marché des changes, bien plus rapidement que les rapports COT. Voir c
Up down v6T
Guner Koca
5 (1)
Thise indicator is up down v6  comes with tradingwiev version. purchased people, after installed on terminal ,contact me on mql5  to get BONUS  TradingView version. up-down indicator is no repaint and works all pairs and lower than weekly time frames charts. it is suitable also 1 m charts for all pairs. and hold long way to signal. dont gives too many signals. when red histogram cross trigger line that is up signal.and price probably will down when blue histogram cross trigger line that is dow
Dessine automatiquement les niveaux de support et de résistance PLUS les écarts des bougies de propulsion sur votre graphique, afin que vous puissiez voir où le prix est susceptible de se diriger ensuite et/ou de s'inverser potentiellement. Cet indicateur est conçu pour être utilisé dans le cadre de la méthodologie de trading de position enseignée sur mon site web (The Market Structure Trader) et affiche des informations clés pour le ciblage et les entrées potentielles. L'indicateur comport
How to use Pair Trading Station Pair Trading Station is recommended for H1 time frame and you can use it for any currency pairs. To generate buy and sell signal, follow few steps below to apply Pair Trading Station to your MetaTrader terminal. When you load Pair Trading Station on your chart, Pair Trading station will assess available historical data in your MetaTrader platforms for each currency pair. On your chart, the amount of historical data available will be displayed for each currency pai
Plus de l'auteur
Navigator FX
Chantal Sala
5 (2)
The Navigator is a next-generation panel very easy to use. Apply this indicator on the chart to navigate very quickly through all the symbol and timeframes listed in input. The arrows manage the zoom and time frames. You can customize both the graphic colors and the list of symbols to display. A quick and easy tool that it will help to analyse the charts. Input Values Show_TF_Panel (true/false) it permits to show/hide panel with TF and Arrows 32 symbols COLORS AND SIZE SETTINGS BUTTON_WIDTH B
Time Range Separator  is a useful tool to display a separator period on your platform. You could go in the properties of the indicator, select the desired range and that's ALL. We believe it is a useful and necessary that we wish to share with you for free all our followers. Input Values: TimeFrame = Period Separator Separator_Color = Vertical Color Line Separator_Style = Vertical Color Style Separator_Width = Vertical Line Width Good trading to all and see you soon. Same indicator for MT4 her
FREE
Time Range Separator
Chantal Sala
4.78 (9)
Time Range Separator is a useful tool to display a separator period on your platform. You could go in the properties of the indicator, select the desired range and that's ALL. We believe it is a useful and necessary that we wish to share with you for free all our followers. Input Values: TimeFrame Period Separator GMT_Hour (ex. +1 or -1) to move the lines at Period Time +/- tot hours in input Hide_dates to show or hide the datetime on vertical lines VLine_Color = Vertical Color Line VLine_Styl
FREE
This is a utility to copy in Expert Advisor folder. The EA will force the download of your History Center MetaTrader. It will not download new data from your broker but it will aid your MT4 to charge every chart correctly. You can choose the symbols to download. After the launch, the EA will be removed automatically from the chart. After the launch, you can see results under Experts panel on MT4. The log will show you the data charged or not charged. Symbol TF = Number of candles charged. Ex: Su
FREE
Volume Spyke
Chantal Sala
5 (2)
The Volume Spike indicator is a useful tool to identify the directional market's intention. How Does It Work: The Volume Spike indicator identifies the volume peaks and creates a sensitive rectangle equipped with Alert and Warning Pop Up that it suggests the market's direction. This tool has the ability to select the time frame on which to do the analysis of volume and it gives a great visual signal colored into rectangle. The indicator can identify valid market signals but it can also suggest
HLOC
Chantal Sala
5 (3)
High Low Open Close Levels The indicator HLOC is a good ally to correctly identify the appropriate trend of price. The indicator is designed to be minimally invasive and it shows a visual and sound aid in order to take decision on the market. The indicator is equipped with sound alert and window alert in order to have a reminder of the price movements. We suggest you watch the video below to evaluate its operational benefits. Input values: Show Level (true/false) TimeFramePeriod (refer to line
InfoPanelMarket
Chantal Sala
3.5 (4)
Informational indicator which shows: Swap Price under/upper Open for every Time Frame Spread Time to close the current candle Broker Time Net Change: delta in percentage from Open (MN-W1-D1) Tick Value Volumes Info for every trades open: Lots Breakeven Profit Buy-Profit Sell Equity Symbol Positive values are green and negative values are red (modifiable in input). Inputs: View BE line (enable/disable) View all Symbol (shows the list of symbol) Color (for every text) Line Color (for BE line)
This panel is very simple to use and it is a very ally to manage your positions and orders. Also you can modify your risk, writing in fields directly on Panel. One click on buttons and the operation on market is done! Operations possible: BUY/SELL Break Even Split (close 50% all orders) Close All positions Hedging (opens reverse positions to cover) Close only BUY positions Close only SELL positions Close All pending orders Reverse all positions Please watch the video to verify the very simple
Volume POC
Chantal Sala
5 (3)
Volume POC The Volume POC indicator displays important levels. You can use it as an independent trading system. Warning functions at a candle closing allow you to have some information on the market direction. The graphical display is simple and effective. The levels reported are the result of the study of historical market volumes. These levels give excellent entry points and excellent levels of support and resistance. You can use the indicator also on very low timeframes. It is suitable for
Open All
Chantal Sala
The Open All indicator uses a simple market information that is "Open Candle". This tool is able to show all the openings of all time frames in order to extract information of strength and trendy. You can display 28 instruments with relative time frame interior for a total of 252 informations. The display is fully customizable, you can choose either the symbol and enable/disable Time Frames. Using it correctly you could get valuable aid to intercept correlations and turning points in the market.
The indicator Net Change is a very useful tool able to extrapolate a percentage in order to have a real reference on the performance of the instrument. This indicator is designed to show the main values: you could monitor the Daily, Weekly, Monthly, Quarterly, Semi-annual and Annual percentages. A necessary tool for those who want to really explore the quantitative logic of the market. Input values SYMBOLS SETTINGS Use_Only_Current_Symbol (true/false): Permits to manage only current symbol on
Best And Worst
Chantal Sala
5 (1)
The Best and Worst indicator (similar to Net Change Indicator) has the peculiarity of being a dynamic indicator. It seems a very Stock Exchange Indicator. This means that it is able to draw up a list and put in order the best and worst instruments in descending order. You can choose to show the percentage of any Time Frame: 1M, 5M, 15M, 30M, H1, H4 etc ... This instrument could really give great suggestions on your trading in order to center the right time and to have a total view of the markets
Delta Single Volume
Chantal Sala
3.25 (4)
Volume Delta is a very powerful indicator that reads the supply on the Market. It calculates the Delta from movement of the price and the difference of BUY and SELL Tick volumes. Its special structure allows you to get all timeframe values available on the MT4 platform. A good observation of this instrument can suggest great entry points and possible reversal. We are confident that this tool will help you to improve your trading timing. See also for MT5:  https://www.mql5.com/en/market/product/5
Volume Delta Panel
Chantal Sala
4.54 (13)
Volume DeltaPanel is a very powerful indicator that read the supply on Market. It calculates the Delta from movement of the price and the difference of BUY volumes and SELL volumes. The Volumes are added to price and normalized to symbol points. Its special structure allows you to get all Time Frames values available on the platform MT4. Panel can show 28 instruments simultaneously all customizable according to the offer of the Broker. A good observation of this instrument can suggest great en
Price Trend Light
Chantal Sala
4 (1)
Price Trend Light indicator is a beautiful indicator that shows purchasing areas and sales areas. This indicator is designed to follow the movement of the price which rounds on the opening price. It also provides information of trend follow on the break of the minimum and maximum. The indicator has a very simple graphic but effective, above the opening price you will have a light green color and under the opening price there is a red light. On every Break Out of the minimum or maximum sets in in
Power Strength
Chantal Sala
5 (1)
The indicator Power Strength creates a virtual display that takes data from all Symbols. It extrapolates all the informations in order to get the strength and / or weakness to take a decision on market. This tool works only on the Forex Market and not processing data on indices, metals ... It is graphically very attractive and its simplified information could give excellent input signals. You can use this indicator to find inputs on daily or short-term operations or scalping. Input Values PANE
Zoom Price It is a very useful tool that is designed to ZOOM the price positioning on one of the 4 corners of the graph. In addition to display function of the price indicator, Zoom Price is equipped with a check on Bullish or Bearish Breakout Signal that change the label color. Zoom Price is a simple tool that can provide useful informations to improve your operational performance. Input Values: myPeriod - TF to consider for Break Out O Signal LABEL SETTINGS Bullish BreakOut Color Bearish Break
The Price Action Dashboard is an innovative tool to help the trader to control a large number of financial instruments. This tool is designed to automatically suggest signals and price conditions. The Dashboard analyzes all major Time Frame suggesting price action conditions with graphic elements. The Dashboard can suggest you the strength of the trend identifying directional movement, it is an indispensable tool for those who want to open position themselves using market trends identifiers. The
Master Trend Dashboard is a new generation indicator, compact, light and efficient. Each element of this Dashboard is designed to return specific signals as: Price Action, Breakout, Net Change (performance of the instrument), algorithmic studies, correlations and statistical calculations. This tool will change your way of trading allowing you to receive important information. See the Graphic Signals to understand every single signal below: Graphic Signals Symbol name and arrow color Green = Cu
Box Chart
Chantal Sala
5 (1)
The indicator Box Chart is a very useful analysis tool that allows you to know the value of the range in points. The range is written in a label and also it is draw in a rectangle. This indicator works on multi timeframe and you can upload more indicators on same chart to analyze more time frames ranges. The analysis of the range is done following W. G. Gann school. The observation of the range on little time frame returns some good information of trend or reversal. Box Chart is a simple indicat
Market Pressure is a next-generation display. Its simple and intuitive graphics system allows you to receive directions very easy and fast. This indicator can give three different methods of signals: Scalping, Intraday and Multiday. The logic is based on the price action which combined on multiple time frame. It can give very high quality signals. An indispensable tool for those who want to understand the market pressure and the operating trend. The indicator is customizable for both colors for
OCO News Order Manager in an Expert Advisor to Trading News . The usability makes this tool an excellent ally for FAST operations on NEWS Time. We recommend that you try it on demo account to understand what kind of decimals using your broker to set your input values. The EA is usable on every Markets. On news time the spread could be manage from Broker, please make attention. Main functionalities Open STOP PENDINGS ORDER a number of seconds (in input) before News Time Floating of pending orde
Dax Scalping Bracket is a new generation Expert Advisor Panel. This a very professional tool for SCALPING. The usability makes this tool an excellent ally for FAST operations of SCALPING on Index instruments and Forex market. The main feature of this EA is the ability to open multiple operations with a single click. Each position is autonomous and you can set different take profit and stop loss for each position. Special functionalities: STOP MOVE to manage your stop chasing the price BREAK EVEN
Bid Ask Level is a very simple indicator but, at the same time, very powerful . Using the logic of the minimum and maximum of the previous periods is able to intercept the important levels of demand and supply. The indicator permits setting the numbers of history candles to read very important levels in the past and show them in the current chart. You can see these power levels with horizontal lines designed on the chart. The indicator also permits uploading many different levels (of different t
Market Pressure Dashboard is a new generation utility. Its main function is to assist you and give you operational ideas optimizing your analytical work. Using this utility you could monitor a lots of financial instruments (max 28 symbols FOREX) in a very simple way. The Market Pressure indicator allows you to customize the internal list of the symbols to be monitored. The opening function and position management with this panel will be much more comfortable and navigation charts very powerful.
Risk Reward indicator is a very useful tool that allows you to observe in real time the performance risk of a trade. Its use is very simple, just drag it into the chart and see the Risk Reward percentage (for ex: 1:2). We have also included the possibility of extending/reducing the lines in order to observe the important price levels. You can change your levels clicking directly on lines and dragging the level to a new position. The levels will be set very fast with only a click. The indicator k
Open Line
Chantal Sala
3 (1)
The Open Line indicator is a simple indicator that tracks the opening levels of more time sessions. This version allows the user to check the opening levels using different time time frames. It is possible to add on the same chart different Open Lines to have more important horizontal levels. The colors and lines are fully customizable also for the label text. A simple indicator but very powerful to give you a proper orientation for your trading. Input Values TimeFrame (to show the open price
Swing High Low
Chantal Sala
5 (2)
Swing High Low Pattern Recognition is a great indicator able to fix price levels and analyze the market swings. Swing High Low uses a dynamic approach of analysis that allows you to identify easily the best entry levels. The indicator using the minimum and maximum periods of the previous candles to analyze the impulsive movement and finally it sets the entry levels. The entry levels are: fast, good and best . The best is the last confirm of the swing. For a correct use we advise to wait the comp
Target Geometry
Chantal Sala
4.2 (5)
Target Geometry is a next-generation indicator that uses the geometric nature of the markets to give high statistical probability levels ( Fibonacci ). This indicator creates a very important map that optimizes the entry points and it optimally defines your own money management. The indicator can be used both in static mode or in dynamic mode, you can use it on any financial instrument. The use in multi timeframe mode is a very good ally to have. The target levels are high statistical probabilit
Initial Balance Target Strategy is an indicator based on Fibonacci Levels. Its graphics flexibility allows you to adapt very well to your strategies or Trading System setting it with levels in input. The analysis of the time range allows replication of strategies as London Breakout and Kiss . The indicator is fully customizable, you can change colors, texts and percentages of Target. The simplicity and manageability of this indicator makes it an useful tool for all Intraday Trader . Input Valu
Filtrer:
 Sun Ren Gao Yu
1261
Sun Ren Gao Yu 2023.11.18 13:23 
 

L'utilisateur n'a laissé aucun commentaire sur la note

ROBERT URBANSKI
1434
ROBERT URBANSKI 2022.10.21 18:09 
 

L'utilisateur n'a laissé aucun commentaire sur la note

Max
1213
Max 2021.11.01 00:56 
 

L'utilisateur n'a laissé aucun commentaire sur la note

Nikolai Ivankin
665
Nikolai Ivankin 2021.07.21 18:31 
 

L'utilisateur n'a laissé aucun commentaire sur la note

Jonathan Moss
350
Jonathan Moss 2021.06.13 01:56 
 

L'utilisateur n'a laissé aucun commentaire sur la note

moke357
74
moke357 2021.03.06 14:54 
 

L'utilisateur n'a laissé aucun commentaire sur la note

Valentin Butorin
4121
Valentin Butorin 2020.10.03 14:02 
 

L'utilisateur n'a laissé aucun commentaire sur la note

Vitalii Vilnyi
157
Vitalii Vilnyi 2020.08.28 13:33 
 

L'utilisateur n'a laissé aucun commentaire sur la note

Kakurenboo
106
Kakurenboo 2020.06.30 08:19 
 

L'utilisateur n'a laissé aucun commentaire sur la note

Konstantinos Karantonis
149
Konstantinos Karantonis 2018.06.18 02:46 
 

L'utilisateur n'a laissé aucun commentaire sur la note

David Diez
2829
David Diez 2017.11.02 17:10 
 

L'utilisateur n'a laissé aucun commentaire sur la note

Lord John Robert Berendt Von Leviathan III
1068
 

L'utilisateur n'a laissé aucun commentaire sur la note

vivf-69
28
vivf-69 2016.11.01 19:21 
 

L'utilisateur n'a laissé aucun commentaire sur la note

Alexander Dudenchuk
1168
Alexander Dudenchuk 2016.10.28 08:39 
 

L'utilisateur n'a laissé aucun commentaire sur la note

Maksym Mudrakov
29226
Maksym Mudrakov 2016.08.31 08:10 
 

L'utilisateur n'a laissé aucun commentaire sur la note

peng yang
167
peng yang 2016.04.16 16:14 
 

L'utilisateur n'a laissé aucun commentaire sur la note

dia79
24
dia79 2015.09.15 20:18 
 

L'utilisateur n'a laissé aucun commentaire sur la note

Répondre à l'avis
Version 1.4 2022.05.16
v1.4
Add BUY and SELL positions BreakEven
Version 1.3 2017.05.10
Reduced logo dimensions.
Version 1.2 2016.11.15
Add the CORNER where show logo:
- Logo_Corner
Version 1.1 2016.11.01
Logo changed.