ICT Implied Fair Value Gap
- Indicadores
-
Minh Truong Pham
 Hello, my name is Pham and I am a programmer and trader! At here, I create amazing forex indicators and expert advisors for Metatrader.
I will try:
+ Provide best tools base on my 5 years experience as a trader and 10 years as a programmer. - Versión: 1.4
- Actualizado: 8 octubre 2024
- Activaciones: 5
Un Implied Fair Value Gap (IFVG) es una formación de desequilibrio de tres velas conceptualizada por ICT que se basa en la detección de un cuerpo de vela mayor y la posterior medición de la media entre las dos sombras de velas adyacentes.
Este indicador detecta automáticamente esta formación de desequilibrio en sus gráficos y puede extenderse un número de barras establecido por el usuario.
El promedio IFVG también puede extenderse hasta que se detecte un nuevo IFVG respectivo, sirviendo como línea de soporte/resistencia.
Alertas para la detección de IFVG's alcistas/bajistas también están incluidas en este script.
🔶 AJUSTES
- Umbral de sombra %: Porcentaje de umbral utilizado para filtrar IFVG's con sombras de velas adyacentes bajas.
- Extensión IFVG: Número de barras utilizadas para extender las áreas de IFVG's resaltadas.
- Extender medias: Extiende los promedios del IFVG hasta un nuevo IFVG respectivo detectado.
🔶 USO - Los usuarios de este indicador pueden encontrarlo útil principalmente para operar desequilibrios al igual que lo harían para operar Gaps de Valor Justo regulares u otros desequilibrios, cuyo objetivo es resaltar una disparidad entre la oferta y la demanda.
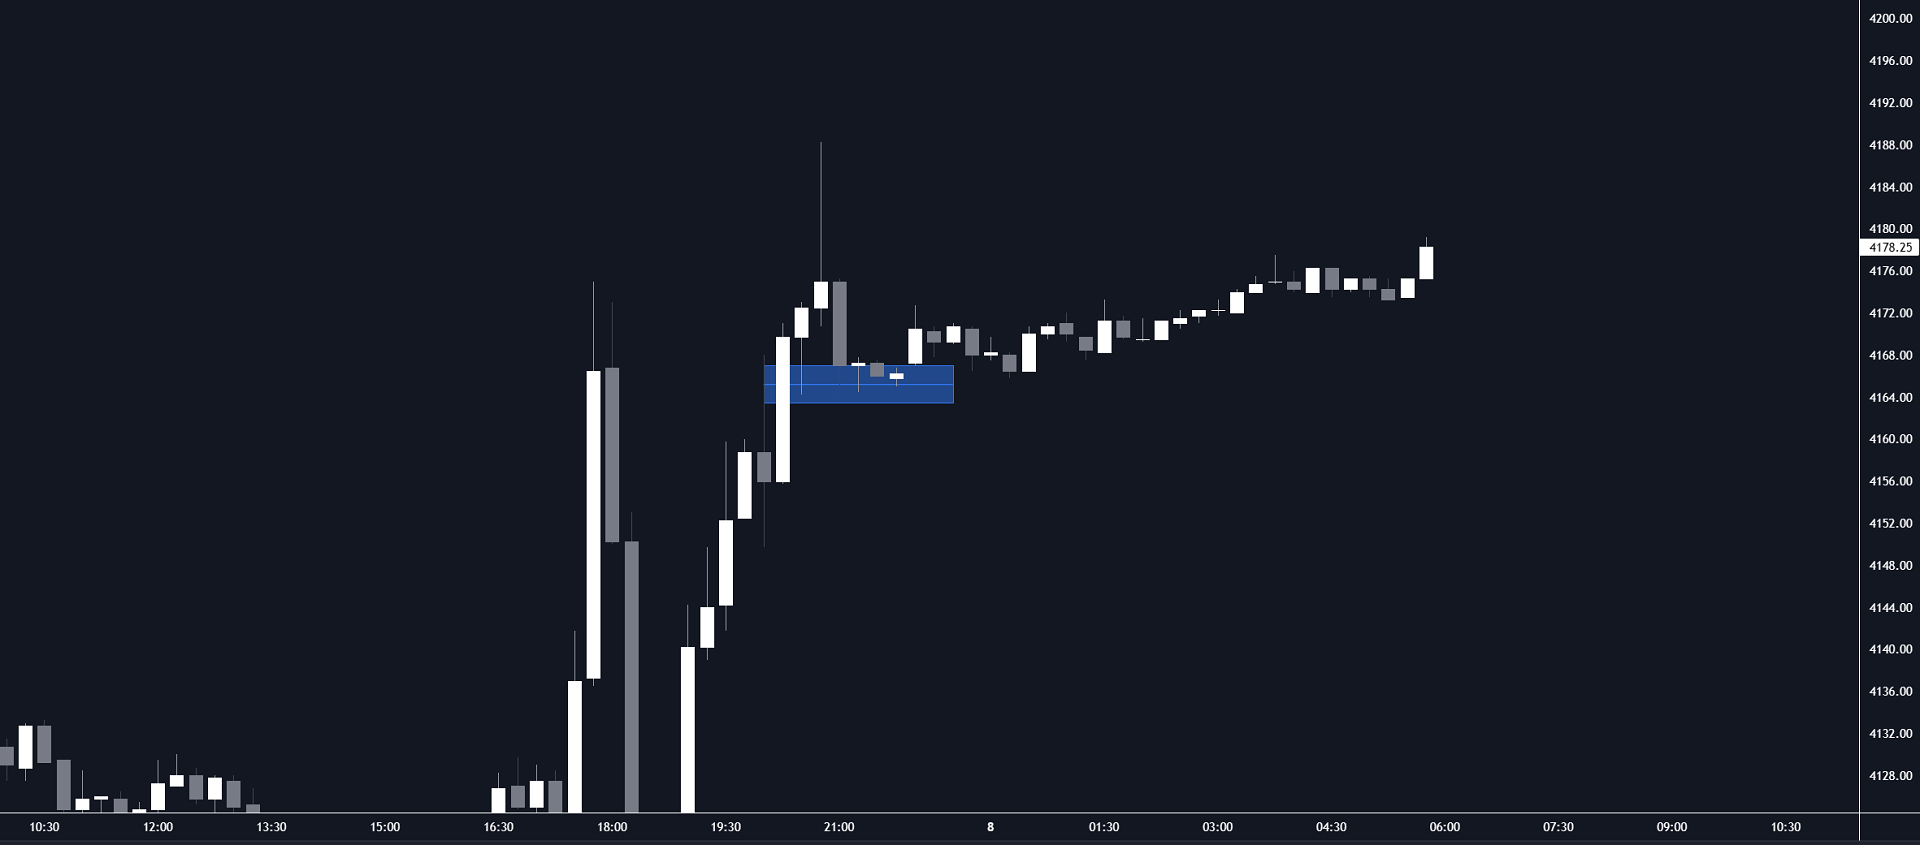
- Para operar un IFVG alcista, los usuarios pueden encontrar este desequilibrio como un área donde el precio es probable que se llene o actúe como un área de apoyo. (imagen 1)
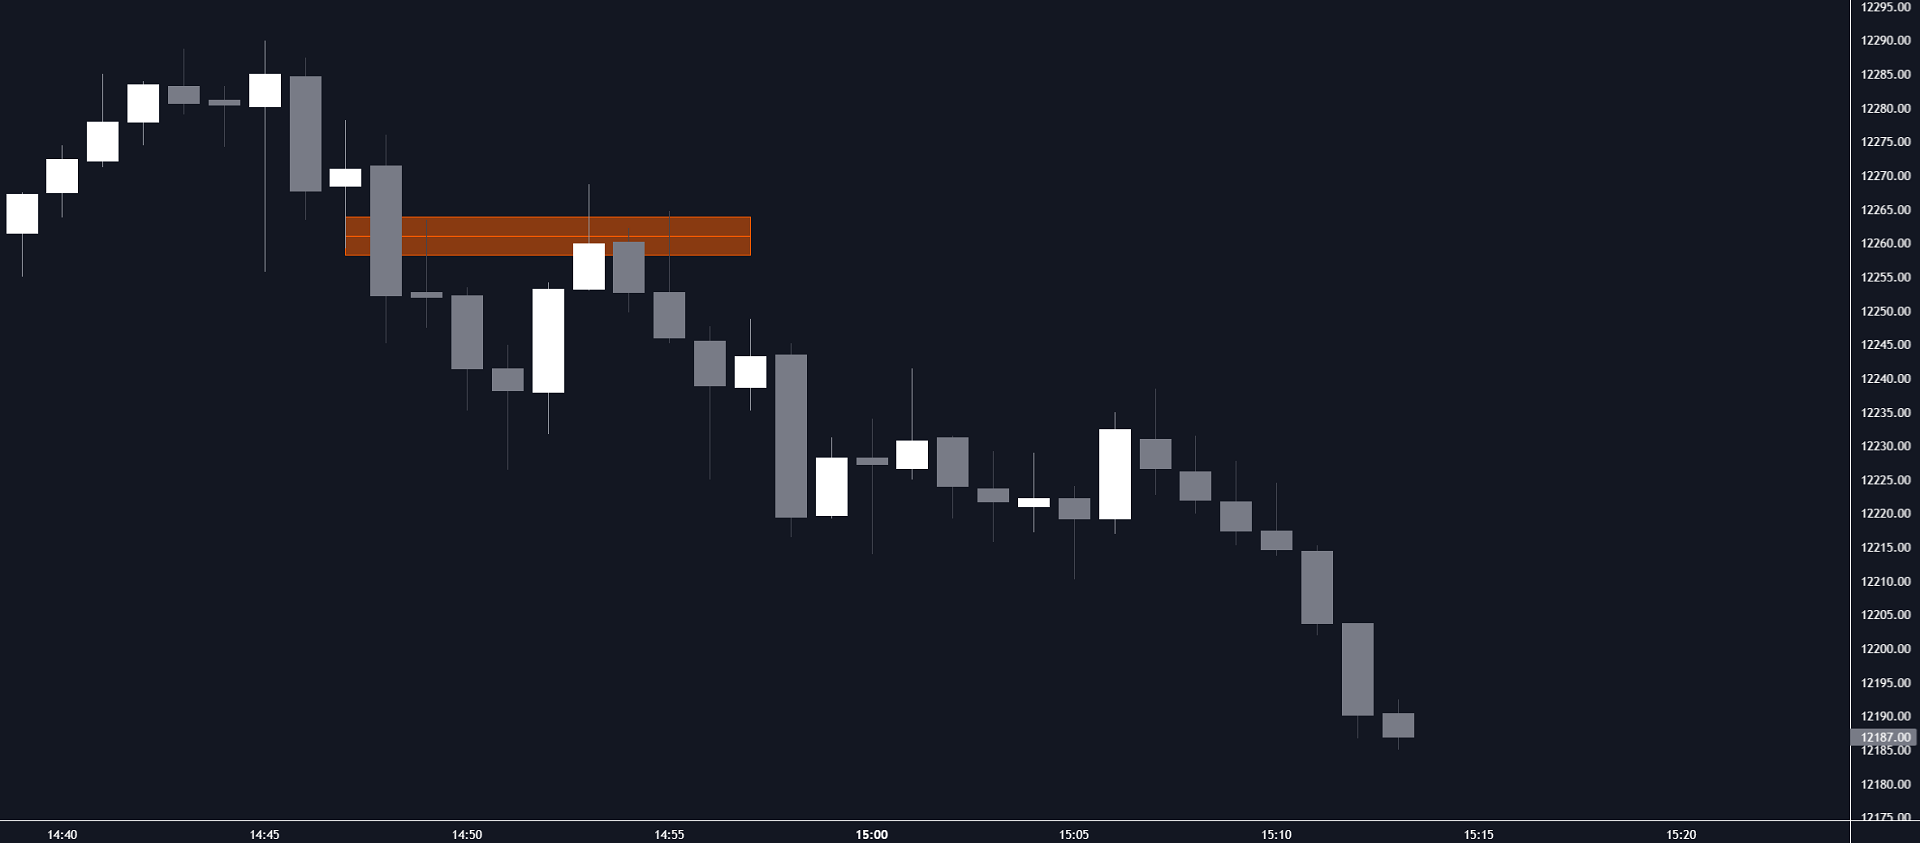
- Del mismo modo, un usuario puede operar con un IFVG bajista considerándolo como una zona en la que es probable que el precio se llene o actúe como resistencia dentro de una tendencia bajista. (imagen 2)
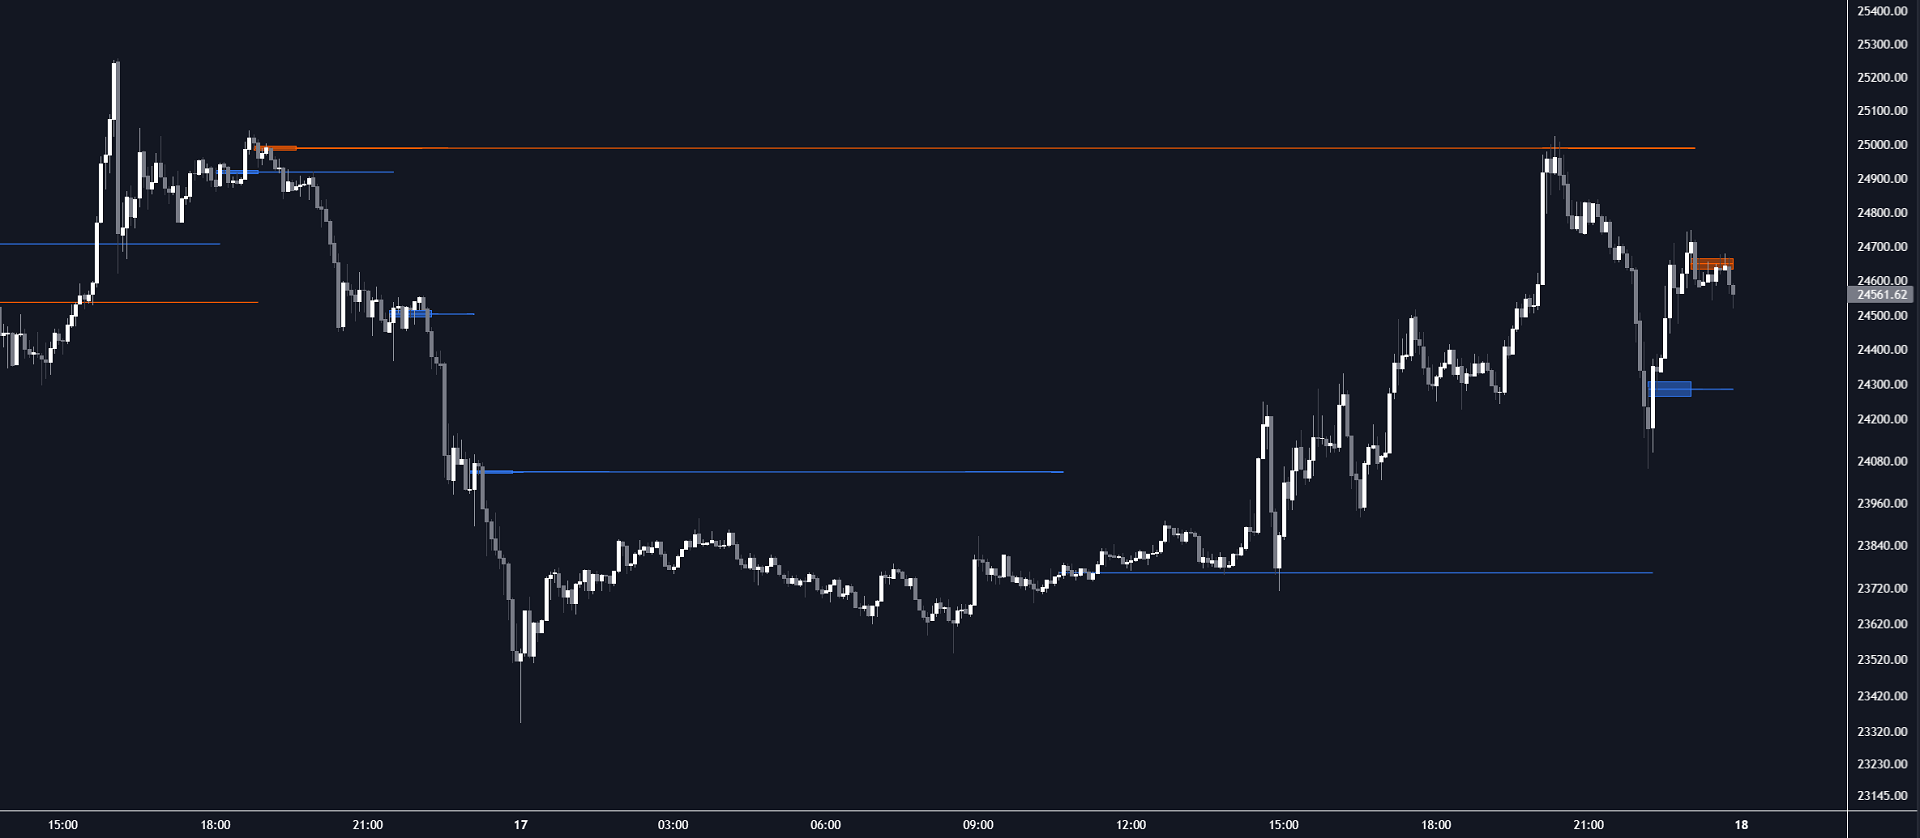
- Los usuarios también pueden ampliar las medias IFVG y utilizarlas como niveles de soporte/resistencia a más largo plazo. Esto puede resaltar la capacidad del IFVG detectado para proporcionar niveles de soporte y resistencia significativos a más largo plazo. (imagen 3)
- 🔶 DETALLES
Se han propuesto varios métodos para la detección de IFVG regulares, y como tal no sería raro ver varios métodos para la versión implícita.
Proponemos las siguientes reglas de identificación para la detección algorítmica de IFVG:
🔹 Alcista - Cuerpo de la vela central es mayor que el cuerpo de las velas adyacentes.
- El mínimo del precio actual es mayor que el máximo de hace dos barras.
- La sombra inferior de la vela actual representa más del p por ciento del rango total de la vela.
- La sombra superior de la vela de hace dos barras representa más del p por ciento del rango total de la vela.
- La media de la sombra inferior de la vela actual es mayor que la media de la sombra superior de la vela de hace dos barras.
donde p es el umbral establecido por el usuario.
🔹 Bajista
- El cuerpo de la vela central es mayor que el cuerpo de las velas adyacentes.
- El precio máximo actual es superior al precio mínimo de hace dos barras.
- La sombra superior de la vela actual representa más del p por ciento del rango total de la vela.
- La sombra inferior de la vela de hace dos barras representa más del p por ciento del rango total de la vela.
- La media de la sombra inferior de la vela de hace 2 barras es mayor que la media de la sombra superior de la vela actual.
donde p es el umbral establecido por el usuario. - El cuerpo de la vela central es mayor que el cuerpo de las velas adyacentes.