Session Volume Profile
- Indicadores
-
Theo Karam
 Soy Theo. Llevo años operando en los mercados, y para mí es más que un trabajo, es mi enfoque diario. He dedicado ese tiempo a entender cómo se mueven realmente los mercados, a refinar estrategias y a aprender algo de cada operación, tanto de las buenas como de las malas.
 - Versión: 2.0
- Actualizado: 4 diciembre 2023
- Activaciones: 20
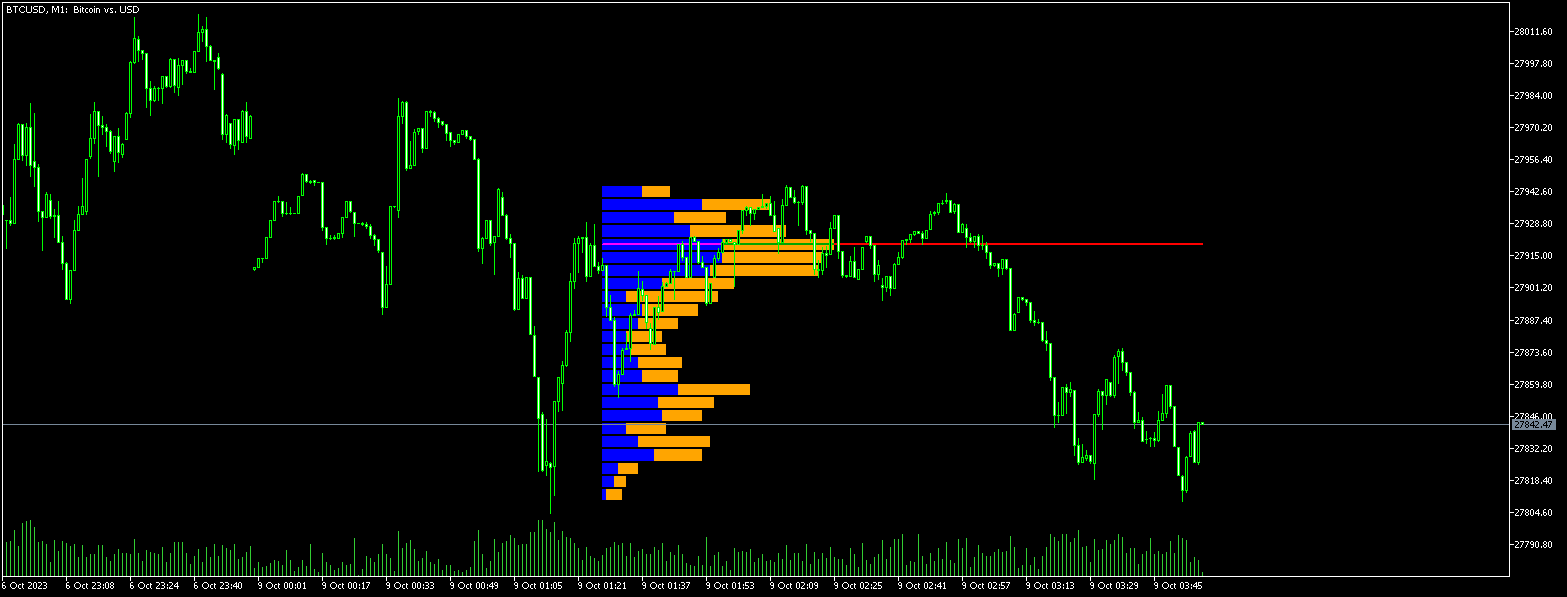
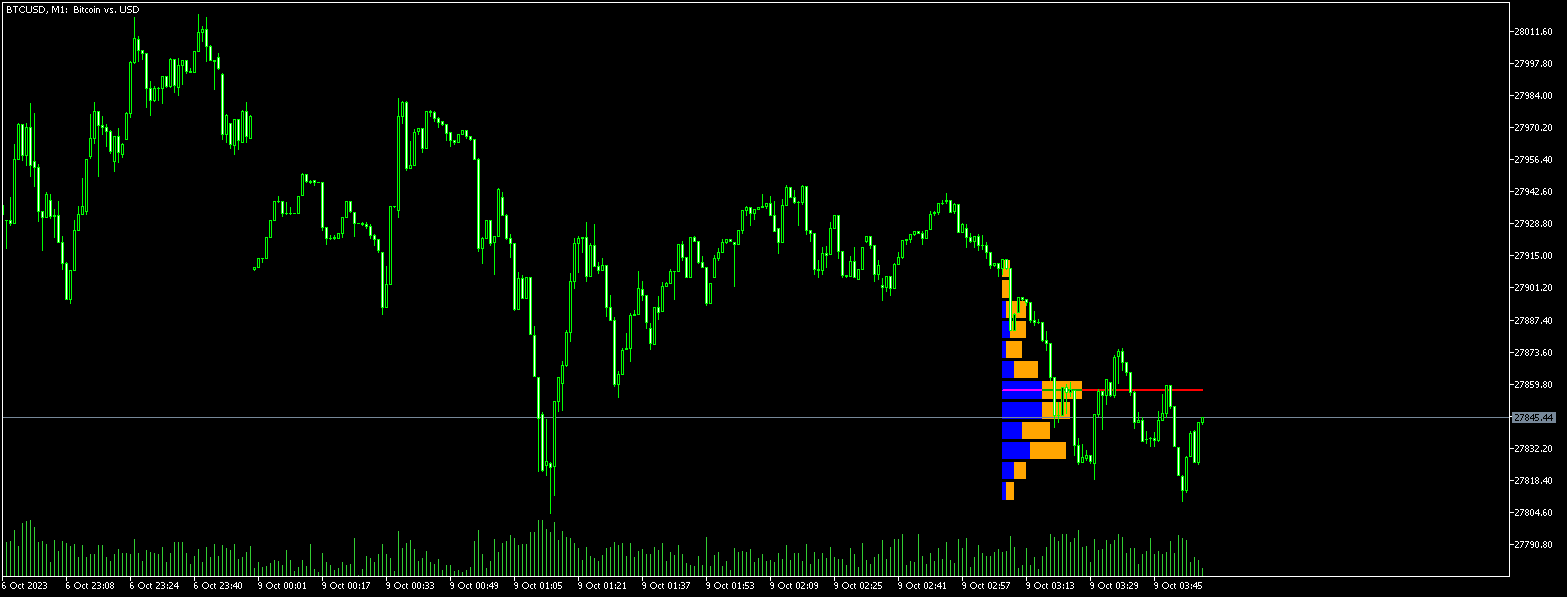
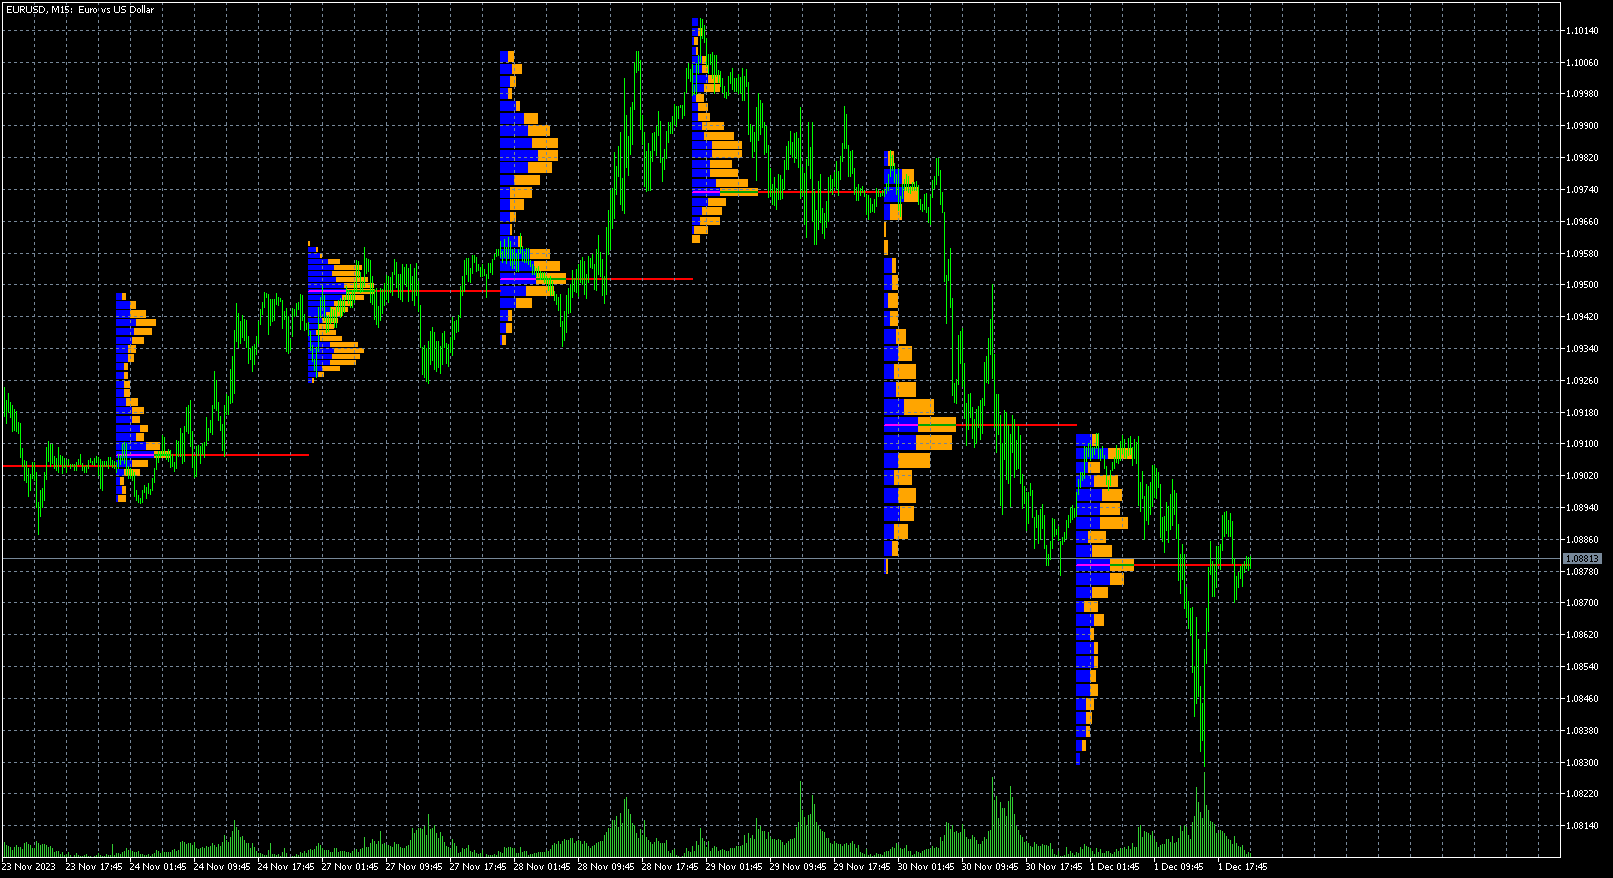
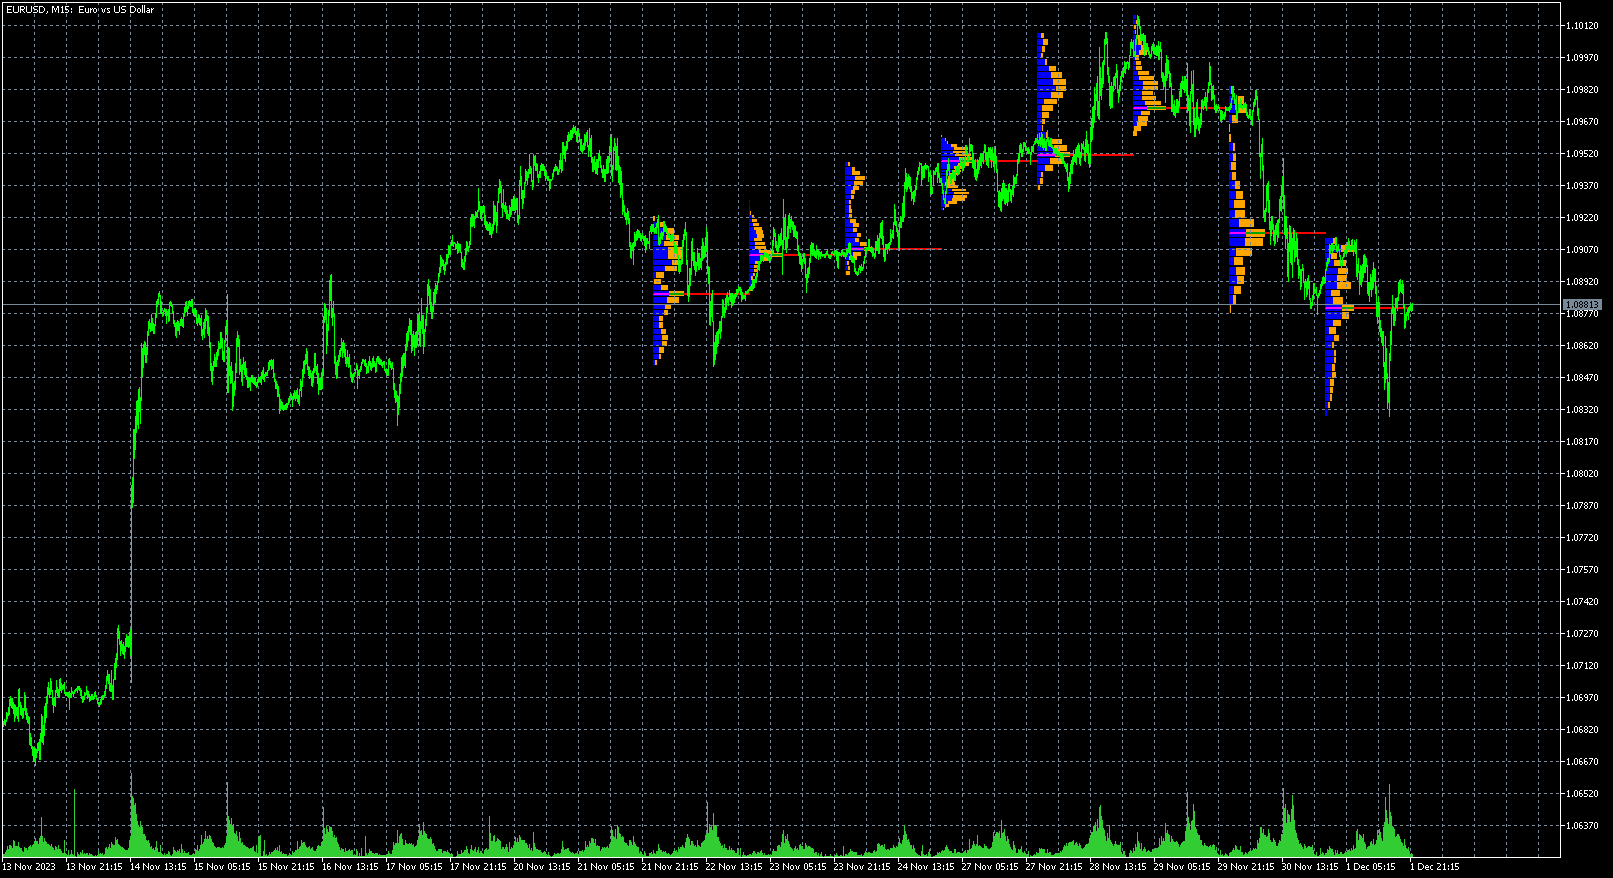
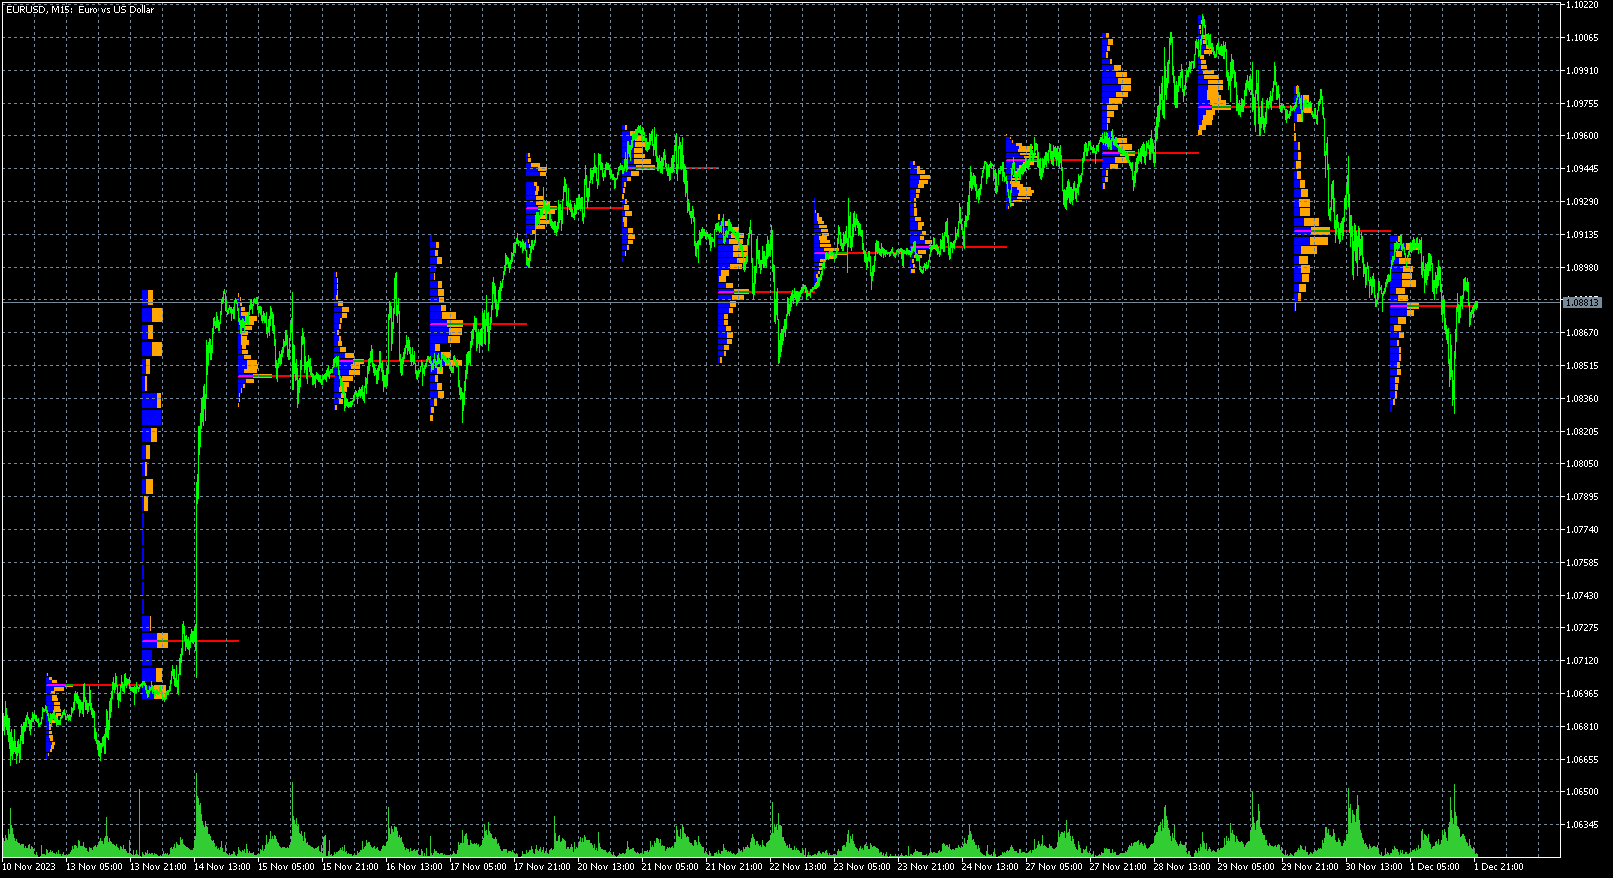
El indicador Perfil de volumen de la sesión muestra la distribución del volumen de operaciones entre los niveles de precios de una sesión concreta. Visualiza las zonas de mayor y menor actividad comercial, ayudando a los operadores a identificar las zonas de soporte y resistencia. El pico del perfil, conocido como Punto de Control (POC), representa el precio con mayor volumen negociado.
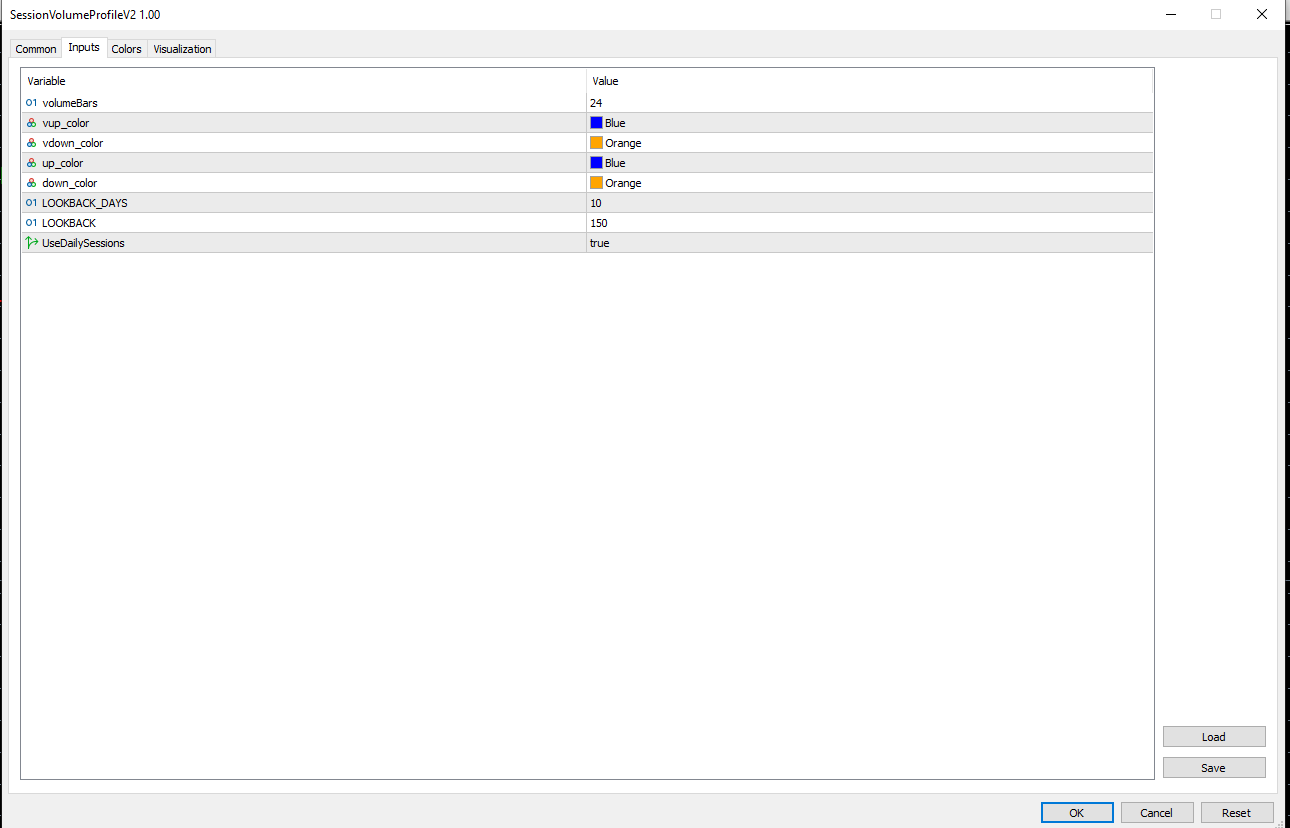
Las entradas del indicador:
- volumeBars(Tamaño de fila): Determina el número de barras o filas de precios para el perfil de volumen. Un número mayor da como resultado una granularidad más fina.
- vup_color: Color para el volumen de las barras "alcistas" dentro del área de valor.
- vdown_color: Color para el volumen de barras "bajistas" dentro del área de valor.
- up_color: Color para el volumen de barras "up" fuera del área de valor.
- down_color: Color para el volumen de barras "down" fuera del área de valor.
- LOOKBACK: Número de barras que analiza el indicador para calcular el perfil de volumen.