Session Volume Profile MT5
- Indicadores
- Versión: 1.2
- Actualizado: 1 julio 2019
- Activaciones: 5

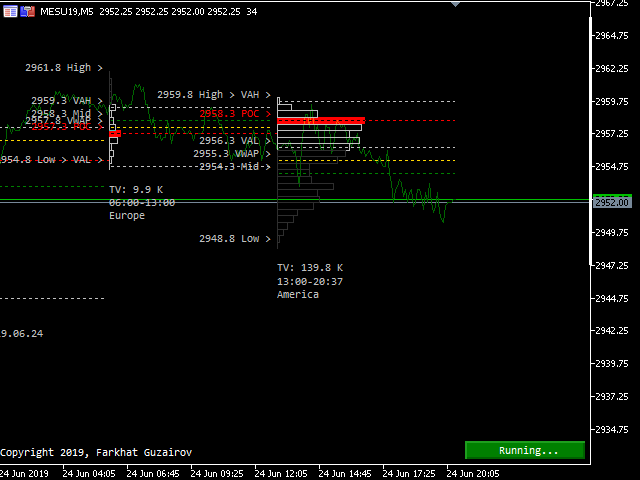
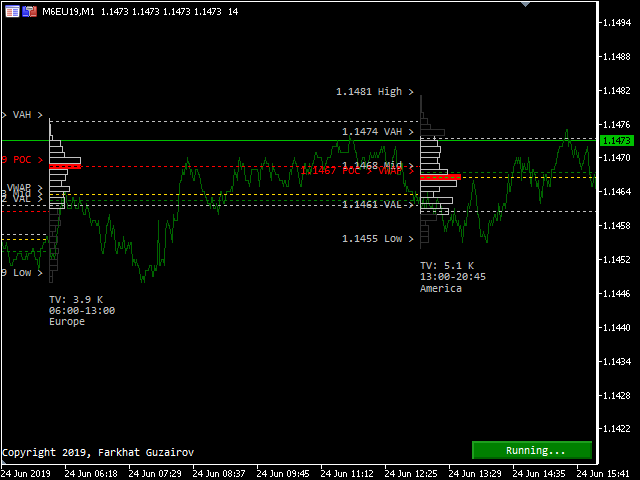
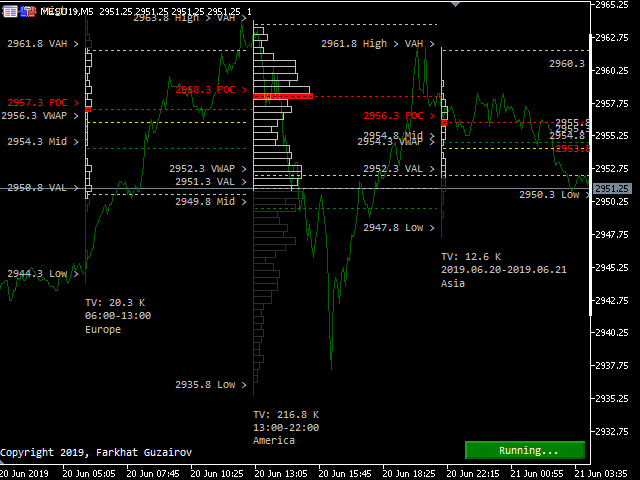
El Perfil de Volumen de Sesión es una representación gráfica avanzada que muestra la actividad de negociación durante las sesiones de negociación de Forex a niveles de precios específicos.
El mercado de divisas puede dividirse en cuatro sesiones de negociación principales: la sesión australiana, la sesión asiática, la sesión europea y la hora de negociación favorita: la sesión americana (EE.UU.).
POC - perfil que puede utilizarse como nivel de soporte y resistencia para la negociación intradía.
- Volúmenes - Volumen al precio tick de la última operación.
- Precios - Precio del tick como resultado de una transacción de compra / venta.
- VolumeType - tipos de perfil;
- DigitsSet - número de dígitos decimales que determinan la exactitud del precio del símbolo del gráfico actual.
- Width - anchura (paso de marcación DigitsSet)
- ShiftOn(Days to look back) - número de días (historia)
- Histogramdepth - profundidad del histograma, si hay pocos datos (1.0..más) / muchos (menos> 0.0..1.0), este parámetro permite reforzar o debilitar la representación visual del perfil
- HistogramFill - rellenar el histograma con el color actual del perfil
- FirstSession - la primera sesión
- FirstOffSet - el desplazamiento del perfil de la primera sesión en el tiempo relativo a la hora del servidor del corredor
- SecondSession - la primera sesión
- SecondOffSet - desplazamiento del perfil de la segunda sesión en el tiempo relativo a la hora del servidor del broker
- ThirdSession - la primera sesión
- ThirdOffSet - offset del perfil de la tercera sesión en tiempo relativo a la hora del servidor del broker
- FourthSession - Cuarta sesión
- FourthOffSet - offset del cuarto perfil de sesión en tiempo relativo a la hora del servidor del broker
- ShowPOC - muestra la línea de rastreo VPOC
- ShowVAHighAndLow - muestra los límites de VA de las líneas máxima y mínima
- ShowMid - valor medio del volumen del perfil
- ShowVWAP - precio medio ponderado (VWAP)
- ValueAreaRange - rango de valores de la región [%].
- ColorSchemeProfile - esquemas de color del perfil
- ColorSchemeProfileValueArea - esquemas de color del perfil
- ColorSchemeProfileVPOC - esquemas de color del perfil
- ColorSchemeProfileMid - esquemas de colores de perfil
- ColorSchemeProfileVWAP - esquemas de color del perfil
- ShowInfo - muestra estadísticas del perfil
- Font - nombre de la fuente
- FontSize - tamaño de la fuente
Una breve guía para configurar el indicador para probarlo en el Probador de Estrategias MT5.
- La variable DigitsSet puede tomar valores desdeDigit0 hasta Digit5. Es importante fijar el valor de la variable DigitsSet en un bit menos que la profundidad de bits del propio instrumento, en algunos casos dos dígitos menos. (Ejemplo: EURUSD tiene Digits = 5, en este caso la variable DigitsSet = Digit4 o menos)
- La variable Width puede tomar un valor dex1 a x20. La variable define la anchura del rango de precios y se calcula en relación con el valor de la variable DigitsSet. Cuanto menor sea el valor de Width , más visualmente se expresará la imagen del perfil.
- La variable ShiftOn/Daysto look back puede tomar un valor de0 o más. Se trata de un desplazamiento en el histórico de cotizaciones, siShiftOn/Daysto look back = 0, se construirán los perfiles del día actual.
- La variable IntradayTimeFrame puede tomar un valor deM5 a D1. Este es el marco temporal dentro del cual se construirá el perfil.
- DígitosSet = Dígito4
- Anchura = x1
- ShiftOn/Días para mirar atrás = 0
- IntradayTimeFrame = D1
Importante recordar: En el probador de estrategias, la variable ShiftOn/Daysto look back debe tener un valor de 0, en un gráfico online este valor puede ser cualquiera (dependiendo de la profundidad del histórico de cotizaciones M1 ), cuanto más alto sea el valor, más tiempo se construirán los perfiles.