KT Momentum Histogram MT5
- Indicadores
-
KEENBASE SOFTWARE SOLUTIONS
 Keenbase Trading desarrolla indicadores profesionales y Asesores Expertos (Expert Advisors) para MetaTrader 4 y MetaTrader 5, diseñados para ayudar a los traders a tomar decisiones de trading más informadas.
 - Versión: 1.0
- Activaciones: 10
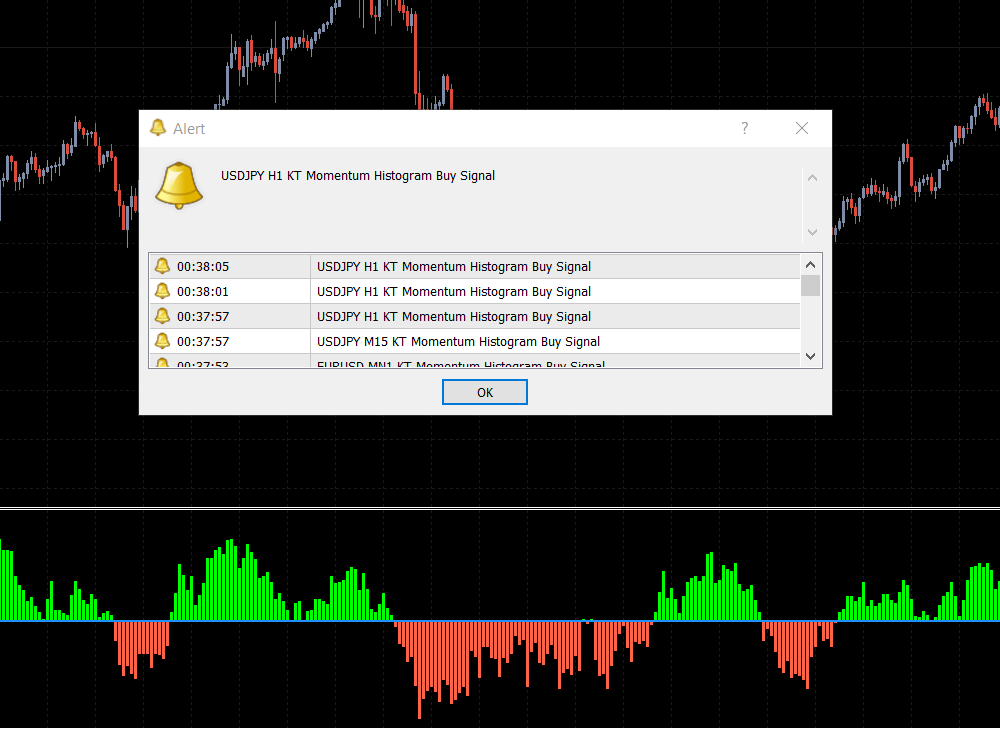
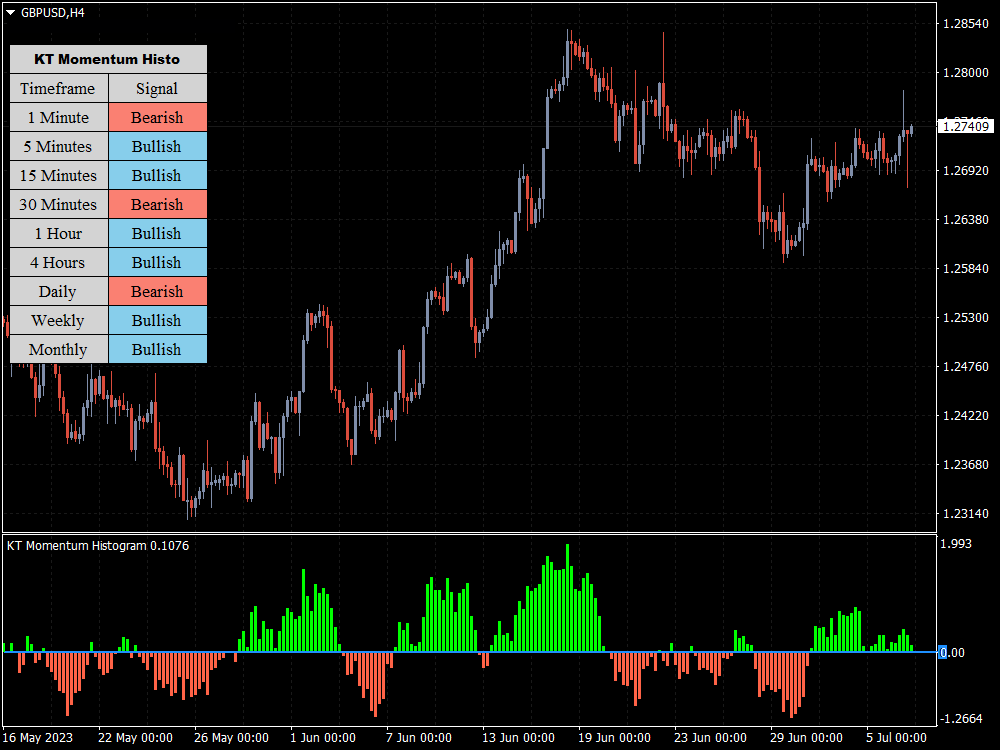
KT Momentum Histogram ofrece a los traders una visualización del momento de un activo, lo que ayuda a determinar la fuerza y la posible dirección de una tendencia. El indicador se calcula y funciona basándose en el impulso del mercado.
¿Qué es exactamente un Momentum Histogram
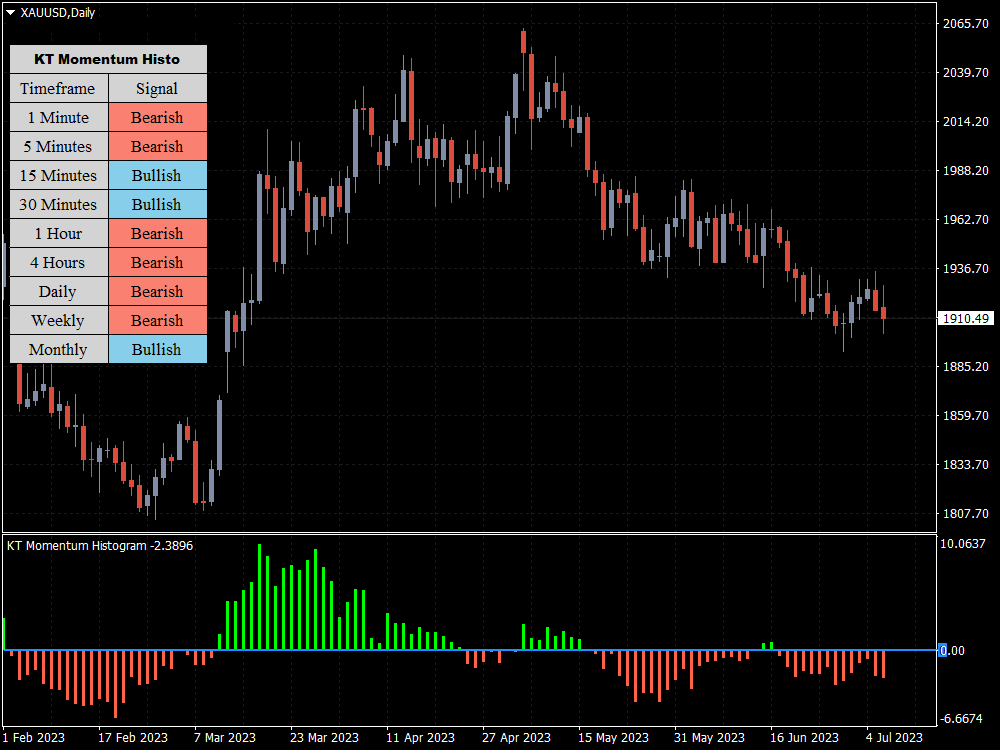
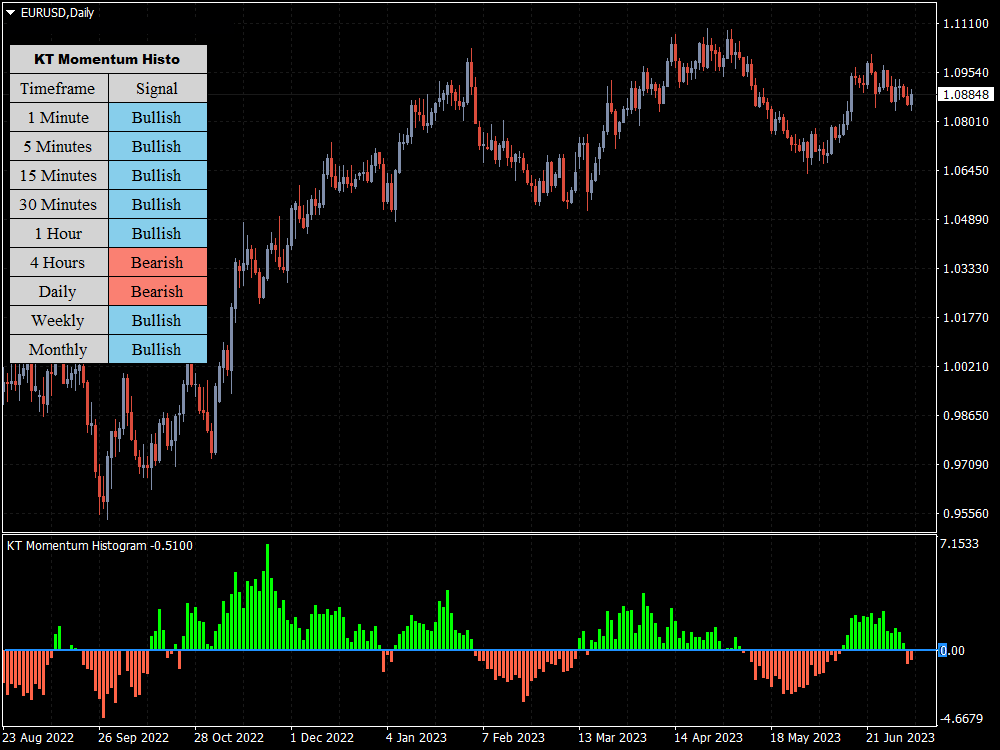
El momentum es la velocidad de aceleración del precio o volumen de un activo; mide la rapidez con que el precio avanza en una dirección durante un periodo determinado. Momentum positivo indica precios en alza, momentum negativo señala precios a la baja. La histograma de momentum es una serie de barras verticales que oscilan alrededor de la línea cero.
Cuando las barras están por encima de cero se interpreta como impulso alcista; por debajo, como impulso bajista. Cuanto más altas o bajas sean las barras, mayor es la fuerza del momento.
Características
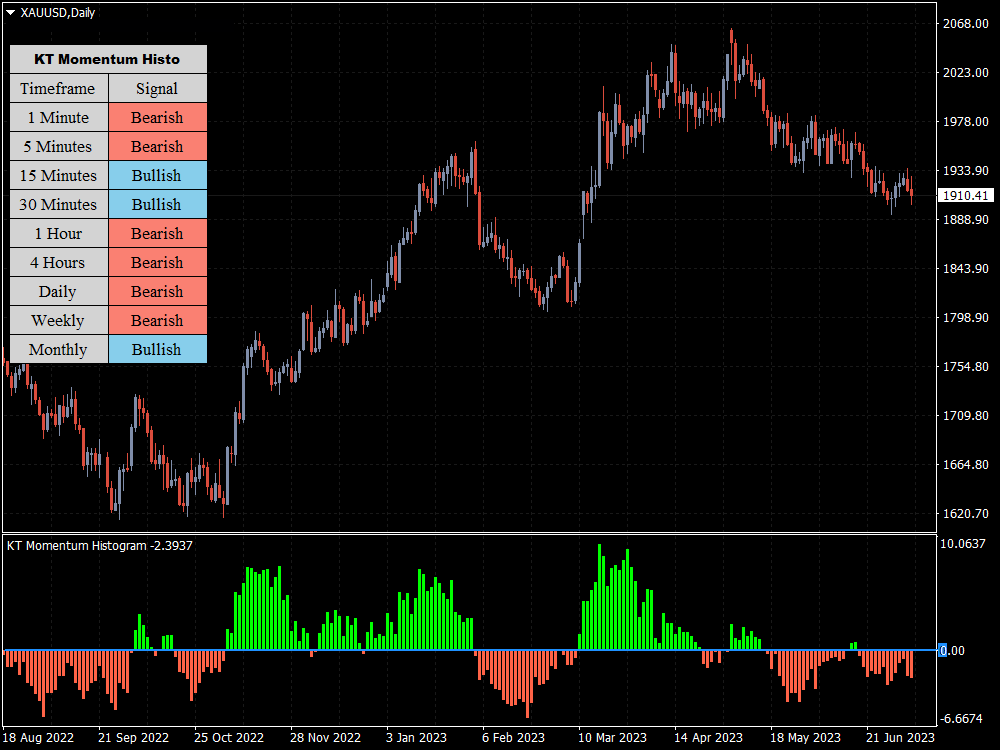
- Identificación de tendencia: Una herramienta fantástica para detectar la tendencia vigente. El cruce de barras por encima de cero puede señalar inicio de tendencia alcista; por debajo, tendencia bajista.
- Magnitud del impulso: Barras grandes denotan mayor fuerza; barras pequeñas indican debilidad.
- Condiciones de sobrecompra/sobreventa: Valores extremos positivos pueden sugerir sobrecompra (posible caída); extremos negativos, sobreventa (posible subida).
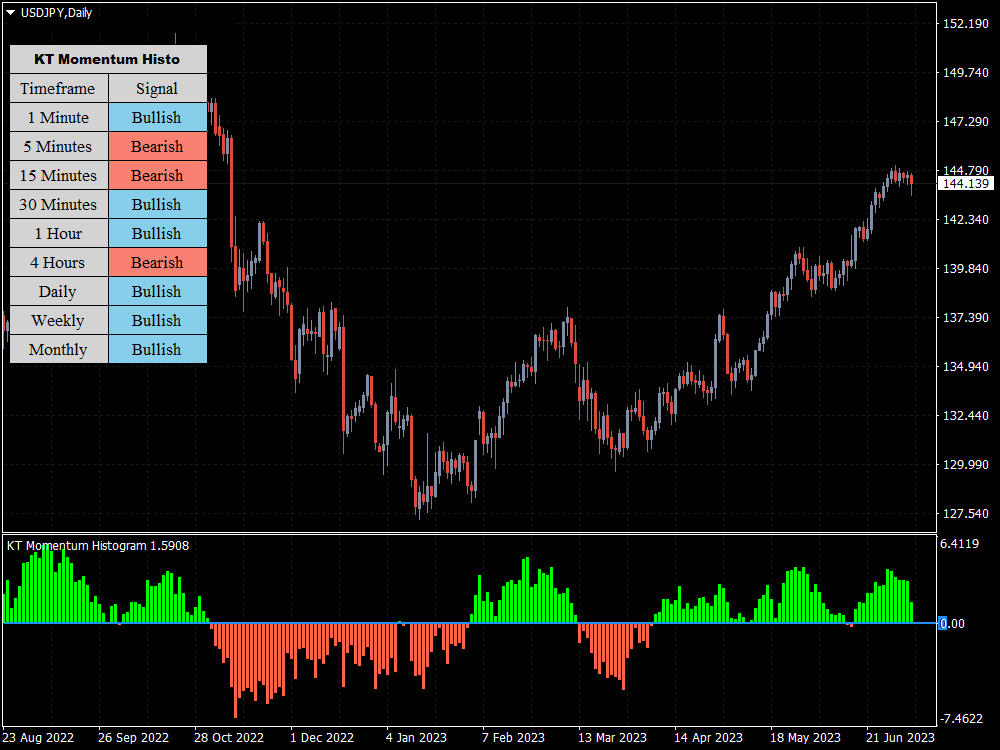
- Detección de divergencias: Precio con máximos más altos y barras con máximos más bajos = divergencia bajista; precio con mínimos más bajos y barras con mínimos más altos = divergencia alcista.
Consejos Pro
- Comprender el contexto del mercado: Un fuerte impulso bajista dentro de una tendencia alcista amplia puede ser solo un retroceso.
- Buscar divergencias: Las divergencias entre el histograma y el precio son señales potentes.
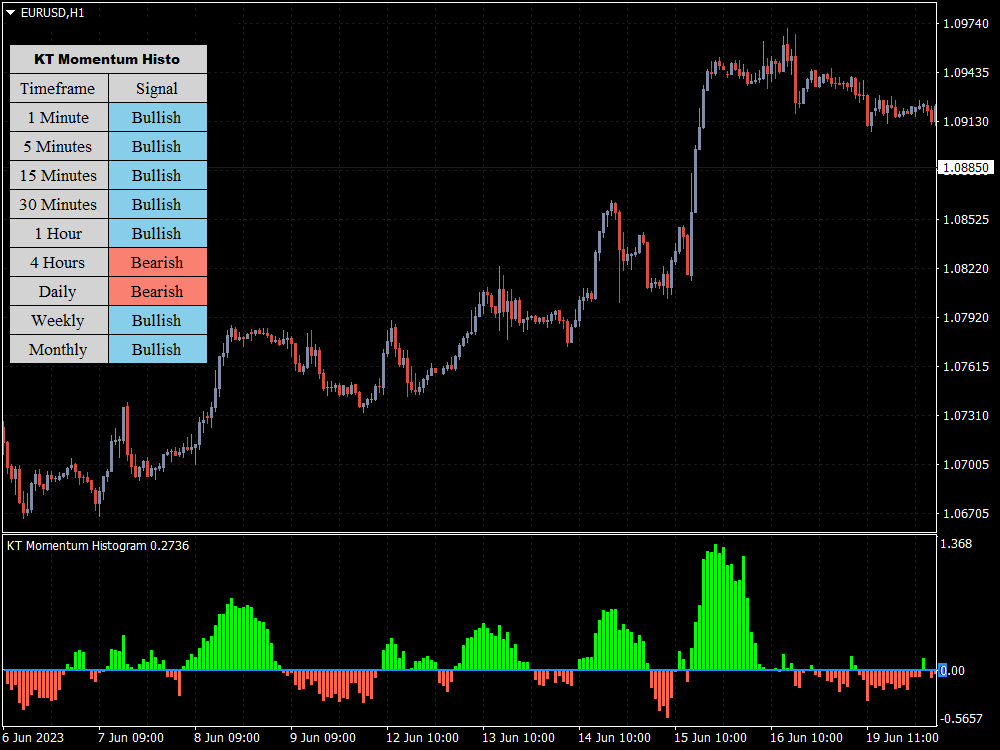
- Sobrecompra/sobreventa no siempre implica giro: Lecturas extremas pueden prolongarse si el impulso es sólido.
- Gestión del riesgo: Usa stops, objetivos y arriesga solo una pequeña parte del capital por operación.