Смотри обучающее видео по маркету на YouTube
Как купить торгового робота или индикатор
Запусти робота на
виртуальном хостинге
виртуальном хостинге
Протестируй индикатор/робота перед покупкой
Хочешь зарабатывать в Маркете?
Как подать продукт, чтобы его покупали
Платные технические индикаторы для MetaTrader 4 - 16

Индикатор Price Alert воспроизводит звуковой сигнал при достижении ценой определенного уровня, заданного трейдером. Если вы используете функцию уведомления по e-mail, не забудьте указать параметры вашей почты в настройках платформы MetaTrader. Входные параметры: WhenPriceGoesAbovePIP - если цена понднимется на указанное количество пипсов выше текущего уровня, сработает оповещение. WhenPriceGoesBelowPIP - если цена опустится на указанное количество пипсов ниже текущего уровня, сработает оповеще

Индикатор показывает среднее движение двух любых коррелирующих валютных пар на одном таймфрейме. Пересечение двух линий (в случае с "EURUSD" (синяя линия) и "USDCHF" (желтая линия)) указывает на восходящий или нисходящий тренд. Входные параметры: symbol1 = EURUSD MAPeriod1 = 13 MAMethod1 = 0. Возможные значения: MODE_SMA = 0, MODE_EMA = 1, MODE_SMMA = 2, MODE_LWMA = 3. MAPrice1 = 1. Возможные значения: PRICE_CLOSE = 0, PRICE_OPEN = 1, PRICE_HIGH = 2, PRICE_LOW = 3, PRICE_MEDIAN = 4, PRICE_TYPICA

Уровни Фибоначчи обычно используются в торговле на финансовых рынках для определения и обмена уровней поддержки и сопротивления.
После значительного движения цены вверх или вниз новые уровни поддержки и сопротивления часто находятся на этих линиях тренда или вблизи них.
Линии Фибоначчи строятся на основе максимумов / минимумов предыдущего дня.
Ориентир - цена закрытия предыдущего дня.
Индикатор Fractal Support/Resistance Clusters отображает линии поддержки и сопротивления, основанные на фракталах, которые по-прежнему имеют силу. Фрактал считается имеющим силу как индикатор поддержки или сопротивления, если цена предыдущего противоположного фрактала не была преодолена. Кластеры зон поддержки и сопротивления определяются с помощью алгоритма DBSCAN (density-based spatial clustering of applications with noise algorithm, пространственная кластеризация приложений с шумом по плотнос

Индикатор отображает на графике сигналы согласно стратегии Билла Вильямса: Сигнал "Первый мудрец" формируется, когда появляется разворотный бар с ангуляцией. Бычий разворотный бар - у которого более низкий минимум и цена закрытия в верхней его половине. Медвежий разворотный бар - более высокий максимум и цена закрытия в нижней его половине. Ангуляция образуется, когда все три линии Аллигатора переплетены, а цена уже значительно ушла вверх (или вниз). Действительный разворотный бар соответствует
Общая информация Это версия DELUX серии индикаторов Pivot Point Plotter Series. Это надежный индикатор, который динамически вычисляет и строит на графике любые четыре основные точки разворота независимо от внутридневного таймфрейма, на котором вы используете индикатор. Индикатор рисует точки разворота STANDARD, CAMARILLA, FIBONNACI и WOODIE. Какой бы из них вы ни использовали в своей торговле, этот индикатор самая выгодная покупка. Пожалуйста, обратите внимание, что это дневной вариант индикатор

Индикатор Two Moving Averages, одновременно отображает в главном окне графика две Средние Скользящие линии с настройками по умолчанию: Зеленая и Красная, которые представляют собой краткосрочный тренд. Настройки скользящих средних и цвета можно поменять. Однако замечу, что данные параметры подобраны таким образом, что позволяют торговать на всех временных интервалах. Вариант применения Средних Скользящих линий в прибыльной, мультивалютной Торговой Стратегии для всех временных интервалов, котора

Индикатор Three Moving Average, одновременно отображает в главном окне графика три Средние Скользящие линии с настройками по умолчанию: Зеленая и Красная представляют собой краткосрочный тренд, Красная и Синяя - среднесрочный тренд. Настройки скользящих средних и цвета можно поменять. Однако замечу, что данные параметры подобраны таким образом, что позволяют торговать на всех временных интервалах. Вариант применения Средних Скользящих линий в прибыльной, мультивалютной Торговой Стратегии для вс

Это индикатор-предсказатель изменений курса, основывающийся на принципе отображения графика. Он использует идею о том, что колебания курсов состоят из фаз "воздействия" и "реакции", причем "реакция" соизмерима и похожа на "воздействие", поэтому для её прогнозирования можно применить зеркало. У индикатора 3 параметра: predict - количество баров для прогнозирования (24 по-умолчанию); depth - количество баров в прошлом, которые будут использоваться в качестве точек отображения; для всех depth отобр

Этот индикатор анализирует поведение цен в прошлом, чтобы предвидеть давление покупок и продаж на рынке: он делает это, оглядываясь в прошлое и анализируя ценовые пики и спады вокруг текущей цены. Это современный индикатор подтверждения. [ Руководство по установке | Руководство по обновлению | Устранение неполадок | FAQ | Все продукты ] Прогнозировать давление покупателей и продавцов на рынке Избегайте быть пойманным на покупке продажи безумия Нет настроек и не требуется оптимизация Индикатор р
Поддержка возникает, когда падающие цены останавливаются, меняют направление и начинают расти. Поддержка часто рассматривается как «пол», который поддерживает или удерживает цены. Сопротивление - это уровень цен, на котором растущие цены останавливаются, меняют направление и начинают падать. Сопротивление часто рассматривается как «потолок», препятствующий росту цен. Данный индикатор рисует линии поддержки и сопротивления, рассчитанные по nBars барам. Если параметр Fibo = true, между этими линия

Индикатор предназначен для защиты вашей открытой позиции на любом таймфрейме и валютной паре.
Длинная позиция Если текущая цена находится выше тейк-профита или ниже стоп-лосса, а позиция брокером не закрыта, индикатор создает файл в Excel под именем: Buy-TP_Symbol_Date.csv или Buy-SL_Symbol_Date.csv и помещает его в папку: C:\Program Files\ ........\MQL4\Files Файл Excel для Buy-TP содержит дату (Date) и время (Time) в формате ЧЧ:ММ:СС, когда цена Bid превышала тейк-профит. Файл Excel для Buy

Если вы торгуете кроссы (например, AUDJPY, CADJPY, EURCHF, и т.д.), необходимо принимать во внимание, что происходит с основными валютами (особенно, USD и EUR) относительно рабочей пары: например, при торговле AUDJPY, важные уровни AUDUSD и USDJPY могут оказывать эффект. Этот индикатор позволяет увидеть скрытые уровни, рассчитываемые из котировок основной валюты. Он находит ближайшие (по цене) экстремумы в истории заданной глубины. Экстремумы, скорее всего, являются для "мажора" линиями поддержк
Сигналы индикатора: пересечение линией Aqua желтой линии снизу верх является сигналом на покупку, пересечение линией Aqua желтой линии сверху вниз является сигналом на продажу. Входные параметры: Period1 = 13. Method1 = 2. MODE_SMA=0, MODE_EMA=1, MODE_SMMA=2, MODE_LWMA=3. Period2 = 5. Method2 = 0. MODE_SMA=0, MODE_EMA=1, MODE_SMMA=2, MODE_LWMA=3.

Индикатор предназначен для таймфрейма H1 и показывает: Сумму бычьих пунктов (зеленая гистограмма). Сумму медвежьих пунктов (красная гистограмма). Иными словами,по количеству и соотношению бычьих пунктов к медвежьим вы можете делать технический анализ состояния рынка. Если зеленая гистограмма превалирует над красной вы можете сделать вывод что в даччый момент покупатели сильнее продавцов и наоборот, если красная гистограмма превалирует над зеленой - продавцы сильнее покупателей

Индикатор отображает наиболее заметные текущие уровни цен и их изменения в истории. Он динамически выявляет области значений, в которых движения цен сформировали своего рода аттракторы и рисует для них линии на графике. Аттракторы могут служить линиями поддержки или сопротивления, а также обозначать внешние границы диапазона котировок. Параметры: WindowSize - количество баров в скользящем окне, которое используется для выявления аттракторов; по-умолчанию - 100; MaxBar - количество баров для об

Это индикатор для внутридневной торговли, использующий стандартные формулы расчета дневных и недельных уровней разворота, поддержки и сопротивления, но обновляющий их динамически на каждом баре. Он дает ответ на вопрос, как эти уровни вели бы себя, если бы текущий бар был последним в сутках. В каждый момент времени индикатор учитывает N последних баров, где N - либо количество баров в сутках, либо количество баров в неделе - для дневных и недельных уровней соответственно. Таким образом, "дневные
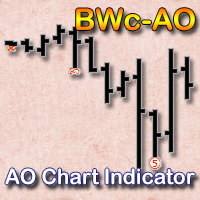
Индикатор отображает на графике сигналы Awesome Oscillator согласно стратегии Билла Вильямса: Сигнал "Блюдце" - это единственный сигнал на покупку (продажу), который возникает, когда гистограмма Awesome Oscillator находится выше (ниже) нулевой линии. "Блюдце" образуется, когда гистограмма меняет направление с нисходящего на восходящее (сигнал на покупку), или с восходящего на нисходящее (сигнал на продажу). При этом все столбцы гистограммы AO должны быть выше нулевой линии (для сигнала на покупк


Индикатор Gann Time Clusters
Индикатор основан на методе Ганна "Квадрат 9" (W. D. Gann's Square of 9) для временной оси. Он использует предыдущие точки разворота рынка, применяет формулу "Квадрата 9" Ганна, а затем делает прогноз (проекции) на будущее. Дата/время, к которому относятся прогнозы, называется 'временным кластером' ('time cluster'). Эти кластеры изображаются в виде вертикальных линий с правой стороны графика, куда рынок еще не продвинулся. Временной кластер обозначает точку разворота

Большинство трейдеров торгует с использованием линий поддержки и сопротивления, и многие строят эти линии как прямые, проходящие через экстремумы графика. Если делать это вручную, то у каждого все получается по-своему - сколько трейдеров, столько и линий поддержки и сопротивления. Но как все же можно быть уверенным, что личный взгляд на график правильный? Этот индикатор помогает решить эту проблему. Он строит полный набор виртуальных линий поддержки и сопротивления вокруг текущей цены и вычисляе

Автоматические линии тренда, с push, email и звуковыми оповещениями. Вид линий (цвет, толщина, тип) отражает историю их взаимодействия с ценой: отскок, пробой, отскок после пробоя, количество отскоков, двойной пробой. Оповещения информируют пользователя об этих событиях. Пользователь может редактировать линии (корректировать, перетаскивать, удалять) и настраивать систему линий, не выгружая индикатор. Для полноценного использования индикатора рекомендуется ознакомиться с руководством в 5-минутном

Индикатор строит гистограмму важных уровней для нескольких основных валют, наложенную на курс текущего кросса. Индикатор имеет смысл, в первую очередь, для кроссов, поскольку влияние на них со стороны "мэйджоров" несоизмеримо больше, чем в обратную сторону. Индикатор показывает гистограмму "скученности" уровней, которые выявляются как экстремумы связанных основных валютных пар. Например, скрытые уровни для AUDJPY могут быть выявлены за счет анализа экстремумов в курсах AUD и JPY относительно USD

Индикатор предоставляет статистическую картину ценовых движений внутридневных баров. Он строит гистограмму усредненных ценовых движений на каждом внутридневном баре, в разбивке по дням недели. Бары с движением выше стандартного отклонения или с более высоким процентом покупок, чем продаж (или наоборот), могут считаться непосредственными сигналами для торговли. Индикатор просматривает историю текущего символа и суммирует изменения котировок на каждом внутридневном баре с учетом дня недели. Наприм
Уровни поддержки и сопротивления - точки, в которых ценовой тренд может прерваться и развернуться - широко используются для краткосрочного прогнозирования цен. Этот индикатор можно использовать в качестве сигнала на покупку и продажу, когда текущая цена поднимается выше или опускается ниже уровней сопротивления/поддержки соответственно, а также как StopLoss для открытых позиций.

Это простой в использовании сигнальный индикатор, который выводит оценку вероятности успешной покупки или продажи в ближайшем будущем, а также выдает предупреждения при возникновении сильных сигналов. Он основан на обработке статистических данных из истории и анализирует изменения цен по отношению к интервалам в барах, за которые эти изменения произошли. Вычисления используют такую же матрицу, как и родственный индикатор - PointsVsBars. После размещения на графике индикатор показывать две метки
Тренд - это направление движения цен в зависимости от того, где они были в прошлом. Тенденции складываются из пиков и спадов. Это направление тех пиков и впадин, которые составляют рыночный тренд. Движение этих пиков и впадин вверх, вниз или в сторону указывает на направление тренда. Индикатор PineTrees достаточно чувствителен (нужно использовать параметр nPeriod для оптимизации), чтобы показать восходящий (зеленая линия) и низходящий (красная линия) тренды.

CCFpExtra - это расширенная версия известного классического кластерного индикатора CCFp. Это полный аналог индикатора CCFpExt для MT5. Хотя версия для MT5 была опубликована в маркете первой, именно версия для МТ4 была разработана и протестирована инзначально, намного раньше открытия маркета для МТ4. Основные возможности поддерживаются произвольные группы тикеров и валют: Форекс, CFD, фьючерсы, спот, индексы; производится выравнивания баров различных символов по времени с учетом возможных пропуск

This particular methodology. Please note the odd sequence in counting, as you will see, it is necessary for the inductive analysis. By starting with a top we are assured of beginning our count on a new wave. (The reverse would apply for a bearish wave.) The 2 point is a top. The 3 point is the bottom of the first decline. The 1 point is the bottom prior to point 2 (top), that 3 has surpassed. The 4 point is the top of the rally after point 3. The 5 point is the bottom after point 4 and is likely

Три основных типа трендов - восходящий, нисходящий и боковой. Восходящий тренд отмечен общим повышением цены. Ничто долго не движется прямо вверх, поэтому всегда будут колебания, но общее направление должно быть выше. Нисходящий тренд возникает, когда цена актива снижается в течение определенного периода времени. Это индикатор, отображающийся в отдельном окне, без каких-либо входных параметров. Зеленая гистограмма означает растущий тренд, красная гистограмма - падающий тренд.

Когда линии сближаются, ограничивая скользящую среднюю, это называется сжатием. Сжатие сигнализирует о периоде низкой волатильности и рассматривается трейдерами как потенциальный признак будущей повышенной волатильности и возможных торговых возможностей. И наоборот, чем шире перемещаются линии, тем выше вероятность снижения волатильности и тем выше вероятность выхода из сделки. Этот индикатор может быть использован на любом таймфрейме и любой валютной паре. Установленный входные параметры могут
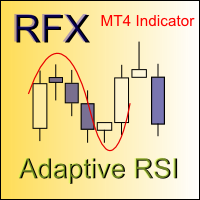
Индекс относительной силы (RSI) - один из самых популярных и точных осцилляторов, широко используемых трейдерами для определения зон перекупленности и перепроданности. Хотя индикатор RSI отлично работает в определенные периоды рынка, он не может генерировать прибыльные сигналы, когда состояние рынка меняется, и, следовательно, выдает неправильные сигналы, которые могут привести к большим потерям. Вы когда-нибудь задумывались об адаптивном индикаторе RSI, который адаптирует период расчета в соотв

Это сигнальный индикатор для автоматической торговли, который предоставляет оценку вероятности успешной покупки или продажи на каждом баре. Он основан на обработке статистических данных из истории и анализирует изменения цен по отношению к интервалам в барах, за которые эти изменения произошли. Ядро индикатора - то же самое, что и в индикаторе PriceProbability для ручной торговли. В отличие от PriceProbability, данный индикатор предназначен для вызова из эксперта или визуального анализа на истор

Суть данного индикатора - анализ и предсказание котировок с помощью преобразования Фурье. Индикатор раскладывает ряд цен на гармоники и вычисляет их продукт на следующих барах. Вы можете использовать индикатор как самостоятельный продукт, однако для улучшения качества предсказания создан другой, родственный индикатор - FreqoMaster - который вызывает FreqoMeterForecast в качестве движка и объединяет результаты работы нескольких экземпляров FreqoMeterForecast для различных частотных диапазонов.

Суть данного индикатора - анализ и предсказание котировок с помощью преобразования Фурье. Индикатор раскладывает ряд цен на гармоники и вычисляет их продукт на следующих барах. Индикатор выводит на истории ценовые метки, обозначающие размах цен в прошлом, а также ценовые метки с предполагаемым движением в будущем. Также прогнозируемое решение о покупке или продаже и размер take profit указывается в текстовой метке в окне индикатора. Индикатор использует в качестве "движка" для расчетов другой ин

Что такое Squeeze? Сокращение полос Боллинджера внутри канала Кельтнера отражает перерыв и консолидацию на рынке и обычно рассматривается как потенциальный индикатор последующего направленного движения или больших колебательных движений. Когда полосы Боллинджера выходят за пределы канала Кельтнера, это означает переход рынков от низкой волатильности к высокой - информация, которую ищут все трейдеры. Чего мне не хватало в некоторых индикаторах, так это возможности мониторить несколько таймфреймов

Что такое Squeeze? Сокращение полос Боллинджера внутри канала Кельтнера отражает перерыв и консолидацию на рынке и обычно рассматривается как потенциальный индикатор последующего направленного движения или больших колебательных движений. Когда полосы Боллинджера выходят за пределы канала Кельтнера, это означает переход рынков от низкой волатильности к высокой - информация, которую ищут все трейдеры. Чего мне не хватало в некоторых индикаторах, так это возможности мониторить несколько таймфреймов
Индикатор отображает на графике сигналы Accelerator Oscillator (AC) согласно стратегии Билла Вильямса. Гистограмма АС - это 5-периодное простое скользящее среднее, построенное на разности между значением 5/34 гистограммы AO и 5-периодным простым скользящим средним, взятым от этой гистограммы. Интерпретация AC основана на следующих правилах - если AC выше нулевой линии, считается, что рыночное ускорение будет продолжать восходящее движение. То же правило применяется для нисходящего движения, если

Дуги Фибоначчи в полных кругах основаны на свече предыдущего дня (максимум - минимум).
Эти дуги пересекают базовую линию на 23,6%, 38,2%, 50%, 61,8% и 78,6%. Дуги Фибоначчи представляют области потенциальной поддержки и сопротивления.
Ориентир - цена закрытия предыдущего дня.
Эти круги будут оставаться неподвижными весь день до начала нового торгового дня, когда индикатор автоматически построит новый набор дуг Фибоначчи.

Этот эффективный индикатор рассчитывает три нарастающих итога от линейно взвешенных результатов виртуальных торгов. Каждый из них соответствует своему режиму в индикаторе ReturnAutoScale . Результат - суперпозиция трех интегрированных, разностно-стационарных рядов, представляющих различные торговые стратегии. Индикатор выводит три линии: желтая - инерционный рынок, соответствует режиму 0 в ReturnAutoScale; blue - средний рынок, соответствует режиму 1 в ReturnAutoScale; red - быстрый рынок, соо
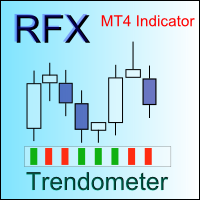
Определение рыночного тренда является важной задачей трейдеров. Индикатор Trendometer реализует усовершенствованный алгоритм для визуализации рыночного тренда. Основной целью индикатора является оценка рынка на мелких таймфреймах (т.е. М1, М5 и М15) для скальпинга. Если вы скальпер и ищете надежный индикатор для улучшения качества вашей торговли, Trendometer - то, что вам нужно. Индикатор работает в отдельном окне, показывая красные и зеленые бары на гистограмме. Два последовательных зеленый (кр

Поддержка и сопротивление представляют собой ключевые моменты, где встречаются силы спроса и предложения. Интересно, что уровни сопротивления могут часто превращаются в зоны поддержки после того, как цена пробьет такой уровень. Этот индикатор рассчитывает и строит на графике 5 пар линий поддержки и сопротивления, аналогично линиям максимума и минимума за текущий и четыре предыдущих дня.
Индикатор использует показатели десяти классических индикаторов: Moving Averages Larry Williams' Percent Range Parabolic Stop and Reverse Moving Averages Convergence/Divergence Moving Average of Oscillator Commodity Channel Index Momentum Relative Strength Index Stochastic Oscillator Average Directional Movement Index для расчета растущего или падающего тренда по текущей валютной паре по мажоритарному принципу для всех таймфреймов.

Индикатор помогает находить точки максимума/минимума. Индикатор не идеален в показе тренда, иногда он показывает тренд против рынка. Но он никогда не пропускает максимальные и минимальные цены в истории. Правила для входа в рынок такие: являются: продавать при падающем тренде (красная линия), пакупать на растущем тренде (синяя линия). Желтые стрелки указывают на возможность продажи, но они должны быть подтверждены падающим трендом. Стрелки цвета морской волны - покупка, но должно быть подтвержде

Этот индикатор представляет собой визуальную комбинацию двух классических индикаторов: Bears и MACD. Индикатор используется так же, как любой из этих индикаторов по отдельности или как оба вместе. Входные параметры: input int BearsPeriod = 9; input ENUM_MA_METHOD maMethod = MODE_SMA; input ENUM_APPLIED_PRICE maPrice = PRICE_CLOSE; input int SignalPeriod = 5.

Продукт объединяет на графике два классических индикатора – Bulls и MACD. Основная идея MACD заключается в том, что он вычитает долгосрочную скользящую среднюю из более краткосрочной скользящей средней. Таким образом он превращает индикатор следования за трендом в импульсный и сочетает в себе функции обоих. Индикатор может применяться так же, как оба классических индикатора вместе или по отдельности. Входные параметры: BearsPeriod = 9; ENUM_MA_METHOD maMethod = MODE_SMA; ENUM_APPLIED_PRICE maPri

Индикаторы Bull and Bear Power определяют, являются ли на рынке сильными продавцы или покупатели, от чего зависит пробой ценового уровня в соответствующем направлении. Индикатор Bears Power пытается измерить аппетит рынка к более низким ценам.
Индикатор Bulls Power пытается измерить аппетит рынка к более высоким ценам. Данный индикатор будет особенно эффективным, когда узкая гистограмма и широкая находиться на одной стороне (выше или ниже нулевой линии).

Данный индикатор следит за рынком в поисках состояния флета и последующего его прорыва. Флет определяется как заданное количество последовательных баров, на которых цена колеблется в небольшом диапазоне. Если один из следующих баров закрывается вне диапазона, индикатор сигнализирует прорыв. Индикатор выводит 3 линии: синяя - верхняя граница диапазона флета И последующая зона контроля прорыва; красная - нижняя граница диапазона флета И последующая зона контроля прорыва; желтая - центр диапазона ф

Если направление рынка вверх, говорят, что рынок находится в восходящем тренде; если он нисходящий, он находится в нисходящем тренде, и если вы можете классифицировать его ни вверх, ни вниз, а скорее колебаться между двумя уровнями, то говорят, что рынок находится в боковом тренде. Данный индикатор показывает восходящий тренд (зеленая гистограмма), нисхдящий тренд (красная гистограмма), а также флэт (желтая гистограмма). Доступен только один входной параметр: ActionLevel. Он влияет на ширину ото
Данный индикатор предсказывает следующий сегмент зигзага, основываясь на вероятностях, полученных из поведения зигзага на истории. Он рассчитывает на истории плотность распределения размеров сегментов зигзага и условные вероятности появления двух соседних отрезков определенных размеров. Затем эти вероятности используются для оценки положения уровней будущего экстремума. Данный индикатор строит зигзаг с помощью другого индикатора - HZZM , однако сам зигзаг не отображается. Вы можете использовать

Данный индикатор предназначен для построения линий тренда, поддержки и сопротивления, как линий, проходящих через последние экстремумы зигзага. Индикатор соединяет отрезками прямых последние два максимума и два минимума зигзага и продолжает их в будущее, где при пересечении их ценой генерируется сигнал прорыва вверх или вниз. В качестве движка построения зигзага может использоваться один из встроенных индикаторов. Внимание: Большинство зигзагов либо перестраивает последний сегмент, либо задержив

Это индикатор, основанный на классических индикаторах: Индекс товарного канала (Commodity Channel Index), Индекс относительной силы (Relative Strength Index) и скользящая средняя (Moving Average). Я использую этот индикатор для открытия длинной позиции когда красная гистограмма меняется на зеленую ниже нулевой линии и для открытия короткой позиции, когда зеленая гистограмма меняется на красную выше нулевой линии . Большим преимуществом этой системы является то, что в индикаторе нет входных парам
Это индикатор прорыва, использующий адаптивные каналы линейной регрессии (Linear Regression, LR) и стандартного отклонения (Standard Deviation, SD). Он находит лучшее покрытие последовательно идущих баров каналами LR и SD, а затем отслеживает цену на предмет прорыва канала, и если это случится, - генерирует сигнал на покупку или продажу. Принцип нахождения лучшего покрытия заключается в подборе такой длины каналов, при которой ширина каналов LR и SD различается меньше всего. На каждом баре канал

3S indicator designed for trend detection without the effect of accidental price leaps. It uses Price Series and a few moving averages for noise reduction. It works on multiple timeframes, even M1. To increase effectiveness, it is recommended to use default parameters for M1 graphic (see screenshots). You can change settings for other time frames. Example of using this indicator : If Gold cross to Blue down and both gold and blue under the Gray , it could be a promising sell signal .
To
Stochastic Oscillator - один из самых популярных и точных осцилляторов, широко используемых трейдерами для определения зон перекупленности и перепроданности. Хотя индикатор Stochastic отлично работает в определенные периоды рынка, он не может генерировать прибыльные сигналы, когда состояние рынка меняется, и, следовательно, выдает неправильные сигналы, которые могут привести к большим потерям. Вы когда-нибудь задумывались об адаптивном индикаторе Stochastic, который адаптирует период расчета в с

Данный индикатор является агрегатором нескольких, построенных на вероятностных расчетах, прогнозов будущих уровней зигзагов. Он использует такой же метод как и индикатор ZigZagProbability . Но в отличие от ZigZagProbability, данный индикатор обобщает результаты анализа 5 зигзагов для различных диапазонов цен. Для каждого зигзага он рассчитывает на истории плотность распределения размеров сегментов и условные вероятности появления двух соседних отрезков определенных размеров. Затем вероятности в

В индикаторе используется несколько экземпляров (отсюда multi ) кластерного индикатора CCFpExtra , и вместе они позволяют получить супер -позицию результатов. Индикатор создает набор CCFpExtra с тщательно подобранными периодами и объединяет их результаты с помощью особых алгоритмов балансировки и нормализации. Не надо больше ломать голову, какие выбрать параметры для кластерного анализа, не надо отлавливать ложные сигналы. И кроме всего, унаследованы все достоинства CCFpExtra : поддерживаются пр

Price Breakout pattern Scanner - это полностью автоматический и мощный анализ для трейдеров и инвесторов. Он определяет следующие паттерны на графике. Голова и Плечи - Распространенный паттерн для торговли. Обратная Голова и Плечи - эта модель обратна паттерну Голова и плечи. Двойная вершина - когда цена дважды достигает уровня сопротивления и снизится к уровню поддержки, трейдер может ожидать внезапный медвежий прорыв уровня поддержки. Двойное дно - двойное дно является противоположностью формы
Индикатор показывает на графике уровни поддержки и сопротивления.
Особенности: Показывает уровни поддержки и сопротивления, за последние 12 месяцев. Показывает максимум и минимум последней недели. Показывает значение "МА 200". Показывает ГЭП-ы, с установленным фильтром.
Настройки индикатора: ShowMA200 – показывать/не показывать значение "МА 200". ColorMA200 – цвет линии "МА 200". LineStyleMA200 - стиль линии 'МА 200". LineWidthMA200 - ширина линии "МА 200". ShowMonth - показывать/не показыв
Если вы торгуете с использованием свечных фигур и хотите усовершенствовать свои методы современными технологиями, этот индикатор для вас. Фактически он является частью набора инструментов, который основывается на нейросетевом движке самоорганизующихся карт (Self-Organizing Map, SOM) для распознавания и предсказания свечных фигур, а также для исследования входных данных и результатов работы сети. Набор содержит: SOMFX1Builder - скрипт для обучения нейронных сетей; он создает файл с обобщенными д

Если вы торгуете с использованием свечных фигур и хотите усовершенствовать свои методы современными технологиями, этот индикатор для вас. Фактически он является частью набора инструментов, который основывается на нейросетевом движке самоорганизующихся карт (Self-Organizing Map, SOM) для распознавания и предсказания свечных фигур, а также для исследования входных данных и результатов работы сети. Набор содержит: SOMFX1Builder - скрипт для обучения нейронных сетей; он создает файл с обобщенными д

Целью этой новой версии стандартного MT4 индикатора, входящего в поставку платформы, является отображение в подокне нескольких таймфреймов одного и того же индикатора и его расхождений. См. пример, приведенный на рисунке ниже. Однако индикатор отражается не как простой индикатор MTF. Это реальное отображение индикатора на его таймфрейме. Доступные настройки в индикаторе FFx Divergences: Выбор таймфрейма для отображения (от M1 до MN) Установка ширины (количество баров) для каждого окна таймфрейма

Целью этой новой версии стандартного MT4 индикатора, входящего в поставку платформы, является отображение в подокне нескольких таймфреймов одного и того же индикатора и его расхождений. См. пример, приведенный на рисунке ниже. Однако индикатор отражается не как простой индикатор MTF. Это реальное отображение индикатора на его таймфрейме. Доступные настройки в индикаторе FFx Divergences: Выбор таймфрейма для отображения (от M1 до MN) Установка ширины (количество баров) для каждого окна таймфрейма

Целью этой новой версии стандартного MT4 индикатора, входящего в поставку платформы, является отображение в подокне нескольких таймфреймов одного и того же индикатора и его расхождений. См. пример, приведенный на рисунке ниже. Однако индикатор отражается не как простой индикатор MTF. Это реальное отображение индикатора на его таймфрейме. Доступные настройки в индикаторе FFx Divergences: Выбор таймфрейма для отображения (от M1 до MN) Установка ширины (количество баров) для каждого окна таймфрейма
Это простой в использовании индикатор для мультитаймфреймового кластерного анализа указанных валют. Он предоставляет простые, но в то же время эффективные сигналы для торговли и дает для них числовые оценки силы сигналов в процентах. После размещения индикатора на графике, он отображает таблицу следующей структуры: все символы, по которым имеются возможности торговли в данный момент, перечисляются по строкам, а торговые стратегии - по столбцам: short-term (краткосрочная, часы), mid-term (среднес

Этот индикатор позволяет анализировать индексы стоимости валют и прочих тикеров. Он отображает изменение относительной стоимости каждого тикера из указанного кластера по годам, месяцам или неделям. Он вычисляет стоимости аналогично тому, как это делает индикатор CCFpExtra , но вместо скользящих средних использует неискажающее сравнение чисел с некоторой начальной стоимостью, привязанной к точке в истории, например, к началу года, месяца или недели. В результаты вы получаете точные изменения стои
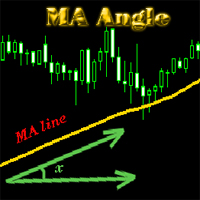
Индикатор MA_Angle рассчитывает угол между линией скользящей средней (MA line) и горизонтальной линией на каждом баре основного графика. Предположим, у нас есть бар n . Линия скользящей средней задается отрезком (см. скриншоты ниже: красная линия соединяет точки скользящей средней на барах n и n+1 ). Индикатор показывает силу рыночного тренда (бычьего или медвежьего). Вы можете настроить отображение угла с помощью параметра "alertAngle" (см. скриншоты ниже). Угол по умолчанию равен 30 градусам.

Целью этой новой версии стандартного MT4 индикатора, входящего в поставку платформы, является отображение в подокне нескольких таймфреймов одного и того же индикатора и его расхождений. См. пример, приведенный на рисунке ниже. Однако индикатор отражается не как простой индикатор MTF. Это реальное отображение индикатора на его таймфрейме. Доступные настройки в индикаторе FFx Divergences: Выбор таймфрейма для отображения (от M1 до MN). Установка ширины (количество баров) для каждого окна таймфрейм

Целью этой новой версии стандартного MT4 индикатора, входящего в поставку платформы, является отображение в подокне нескольких таймфреймов одного и того же индикатора и его расхождений. См. пример, приведенный на рисунке ниже. Однако индикатор отражается не как простой индикатор MTF. Это реальное отображение индикатора на его таймфрейме. Доступные настройки в индикаторе FFx Divergences: Выбор таймфрейма для отображения (от M1 до MN). Установка ширины (количество баров) для каждого окна таймфрейм

Система оповещений торговой платформы MT4 - Two Moving Average Message состоит из двух линий скользящих средних с отдельно настраиваемыми параметрами. Индикатор может подавать сигналы в виде алерта ( AlertMessage ), комментария в левый верхний угол главного окна графика ( CommentMessage ), уведомления на мобильную версию терминала ( MobileMessage ), электронный почтовый ящик ( GmailMessage ), а также проигрывать две разные мелодии при пересечении линий вверх или вниз. Параметры Language – выбрат
MetaTrader Маркет - лучшее место для продажи торговых роботов и технических индикаторов.
Вам необходимо только написать востребованную программу для платформы MetaTrader, красиво оформить и добавить хорошее описание. Мы поможем вам опубликовать продукт в сервисе Маркет, где его могут купить миллионы пользователей MetaTrader. Так что занимайтесь только непосредственно своим делом - пишите программы для автотрейдинга.
Вы упускаете торговые возможности:
- Бесплатные приложения для трейдинга
- 8 000+ сигналов для копирования
- Экономические новости для анализа финансовых рынков
Регистрация
Вход
Если у вас нет учетной записи, зарегистрируйтесь
Для авторизации и пользования сайтом MQL5.com необходимо разрешить использование файлов Сookie.
Пожалуйста, включите в вашем браузере данную настройку, иначе вы не сможете авторизоваться.