TimeShift
- Indicadores
-
Stanislav Korotky
 Trading is just my hobby. I'm working in IT industry. So developement of experts, indicators, and script is not a problem at all to me. Wide range of technologies are used: MQL4, MQL5, system and applied programming, web-services, neural networks and more.
New: - Versión: 1.1
- Actualizado: 22 noviembre 2021
- Activaciones: 5
Si le gustan los patrones de velas, debe ser consciente de su mutabilidad. Desplaza el eje temporal una fracción de una sola barra y verás figuras completamente diferentes. Pero esta fracción puede ser sólo un desplazamiento GMT válido desde otra zona horaria, y estos nuevos patrones de velas deberían funcionar de la misma manera que lo hacen los de su zona horaria.
Este indicador construye barras de velas con tiempos de apertura desplazados en el futuro. Tiene en cuenta su período principal, pero crea barras que comienzan con un desplazamiento especificado, de modo que los precios se ven desplazados por un número especificado de períodos menores: D1 y marcos de tiempo mayores son desplazados por horas, marcos de tiempo por hora y por minuto son desplazados por minutos.
Además del nuevo descubrimiento de patrones de velas, usted verá realmente 1 barra adelante, y la barra contiene todos los últimos períodos menores excepto el desplazamiento inicial de ellos.
Parámetros
- shift - número de periodos menores para desplazar el periodo mayor; por defecto - 0 (ningún desplazamiento);
- width - ancho del cuerpo de la vela; por defecto - 5;
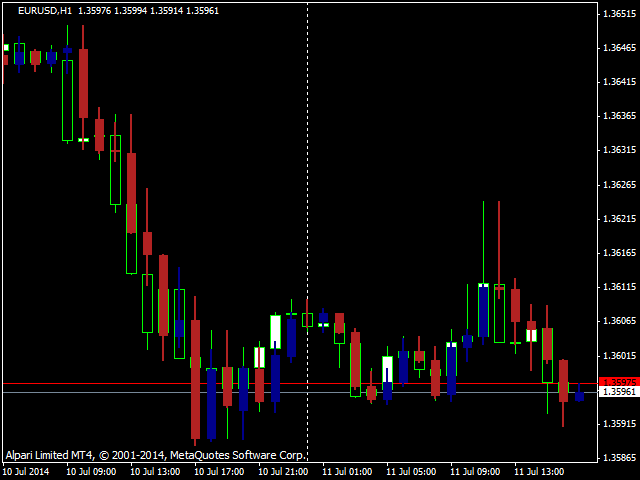
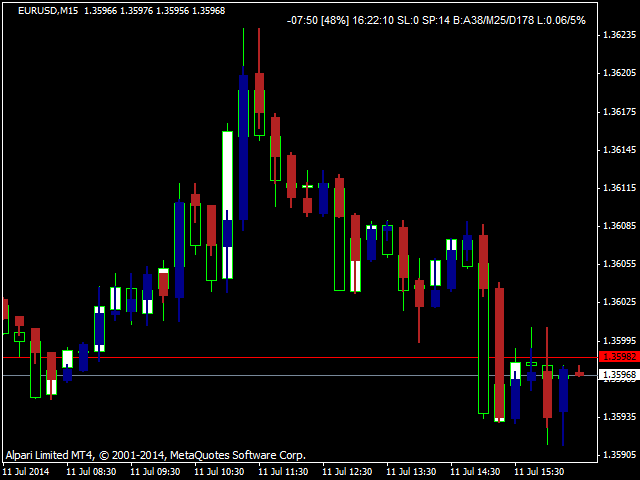
En las capturas de pantalla de abajo puede ver EURUSD D1 y EURUSD H1 desplazados por 12 - para D1 es un desplazamiento de 12 horas, y para H1 es un desplazamiento de 12 minutos; EURUSD M15 está desplazado por 6 (minutos). En todos los casos se muestra una barra "futura" a la derecha de la barra 0-ésima. Esto se debe a que en todos estos casos el desplazamiento fue menor que el número de periodos menores ya transcurridos tras el inicio del periodo mayor.
En otras palabras, los periodos menores con el desplazamiento y el desfase mayores proporcionan datos para la barra "futura". Pero si el desplazamiento es mayor que el tiempo real transcurrido desde el inicio de la barra principal actual, no habrá barra "futura", porque aún no ha comenzado. Por ejemplo, en EURUSD M15 con desplazamiento = 5, no habrá barra "futura" por 5 minutos de inicio, se mostrará desde cada 5º, 20º, 35º, 50º minuto.