Specification
Abstract
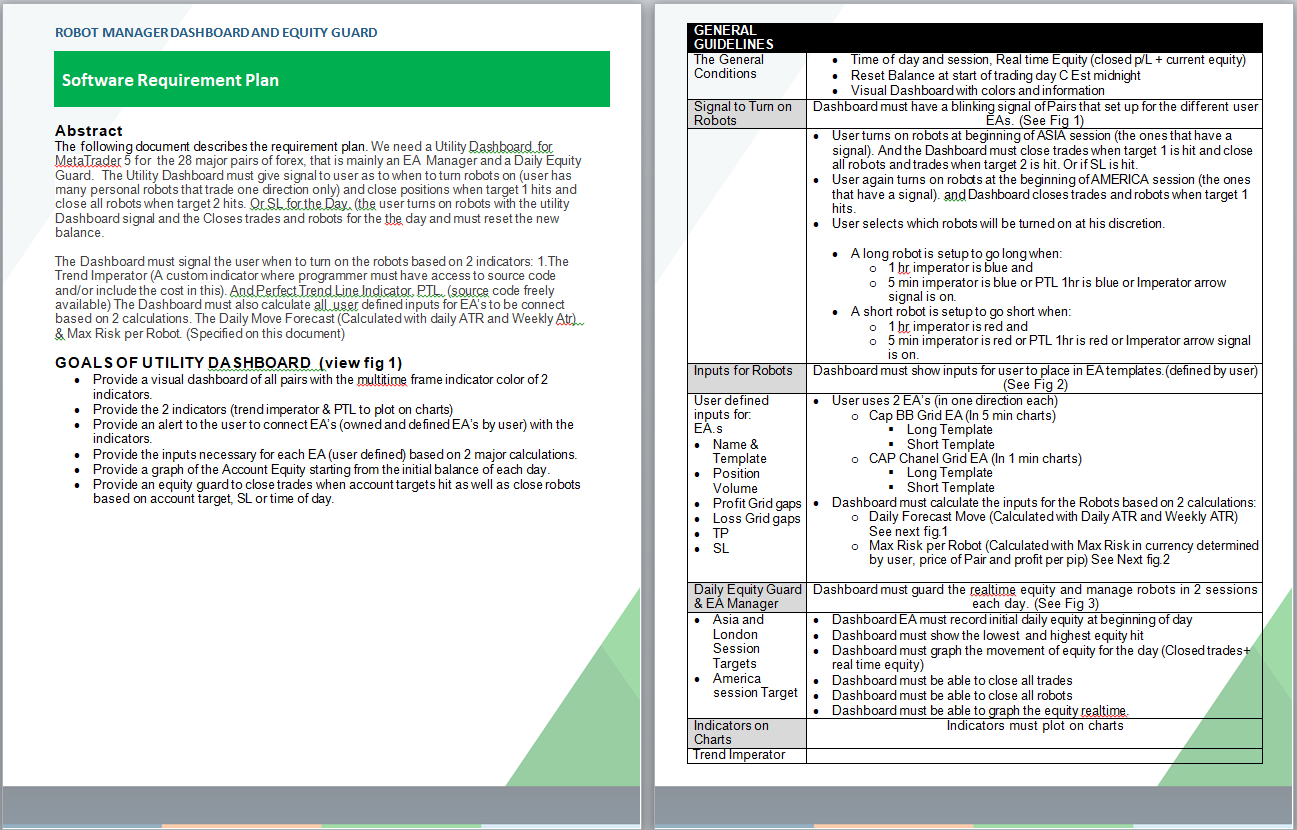
The following document describes the requirement plan. We need a Utility Dashboard for MetaTrader 5 for the 28 major pairs of forex, that is mainly an EA Manager and a Daily Equity Guard. The Utility Dashboard must give signal to user as to when to turn robots on (user has many personal robots that trade one direction only) and close positions when target 1 hits and close all robots when target 2 hits. Or SL for the Day. (the user turns on robots with the utility Dashboard signal and the Closes trades and robots for the the day and must reset the new balance.
The Dashboard must signal the user when to turn on the robots based on 2 indicators: 1.The Trend Imperator (A custom indicator where programmer must have access to source code and/or include the cost in this). And Perfect Trend Line Indicator. PTL. (source code freely available) The Dashboard must also calculate all user defined inputs for EA’s to be connect based on 2 calculations. The Daily Move Forecast (Calculated with daily ATR and Weekly Atr) & Max Risk per Robot. (Specified on this document)
The source code of the development will be required also.
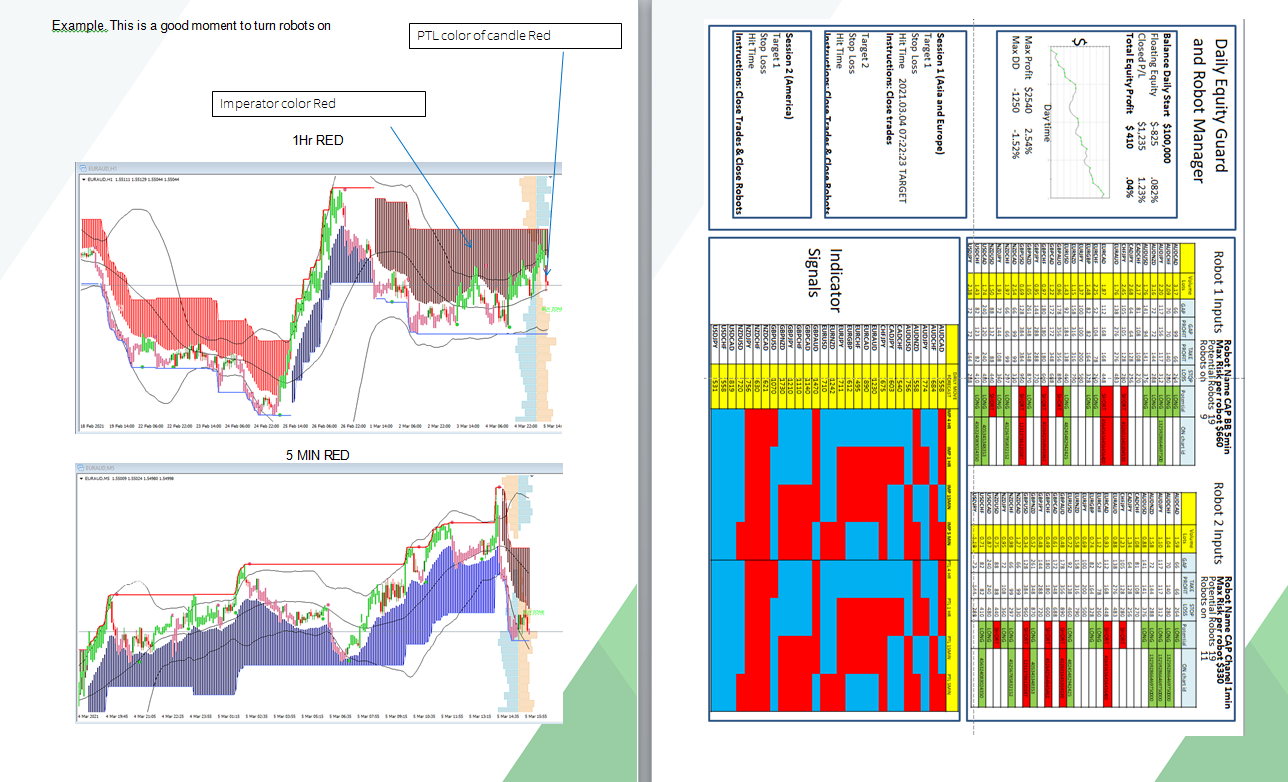
GOALS OF UTILITY DASHBOARD (view fig 1)
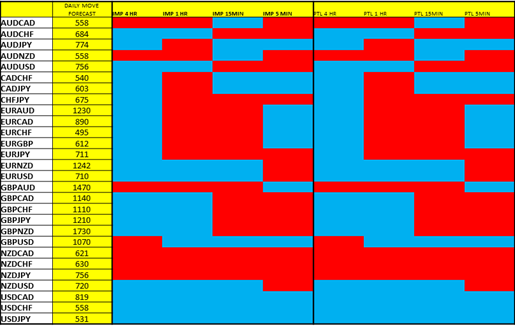
· Provide a visual dashboard of all pairs with the multitime frame indicator color of 2 indicators.
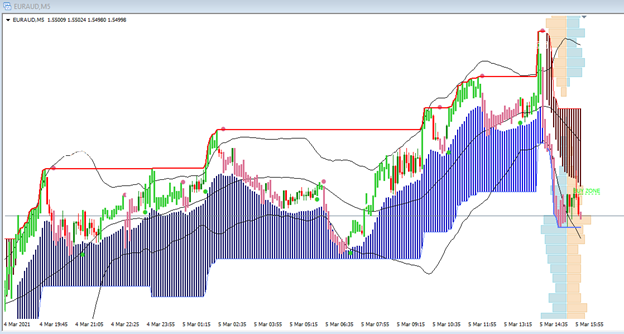
· Provide the 2 indicators (trend imperator & PTL to plot on charts)
· Provide an alert to the user to connect EA’s (owned and defined EA’s by user) with the indicators.
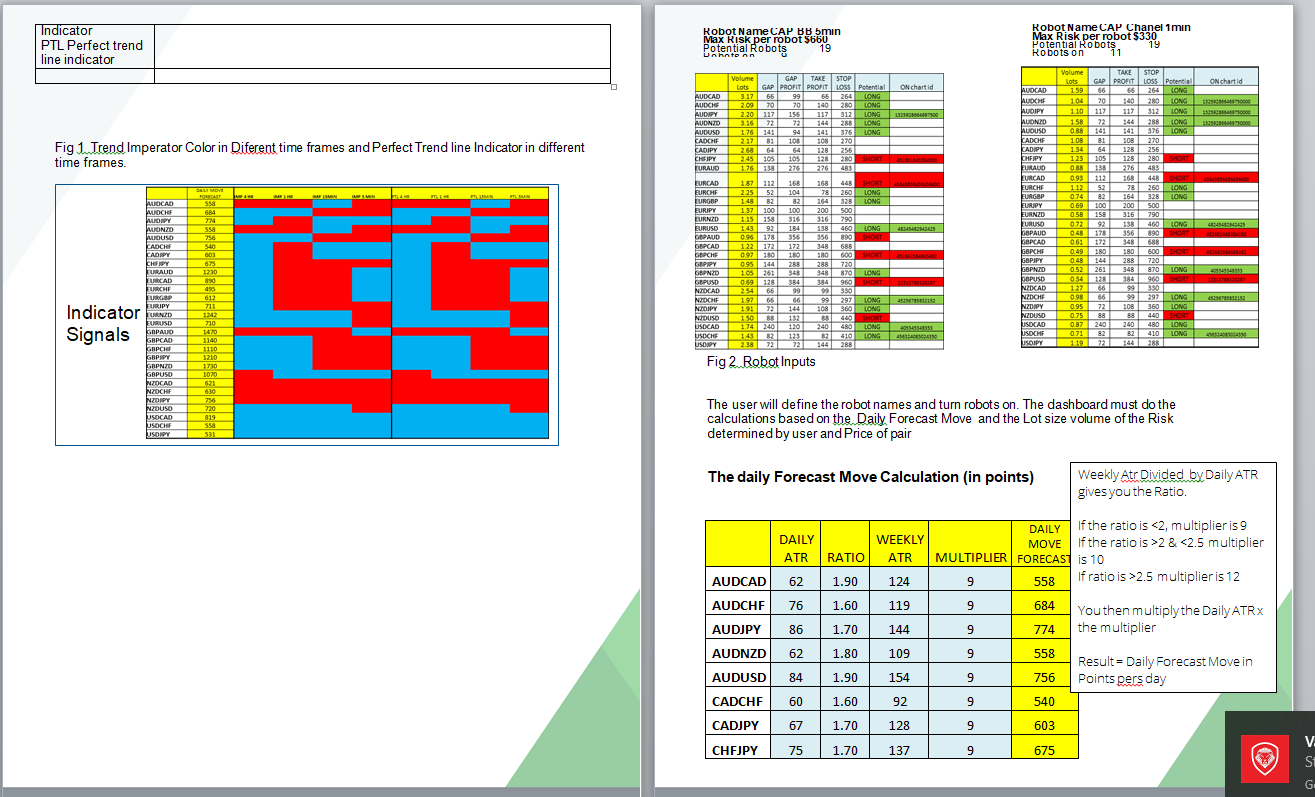
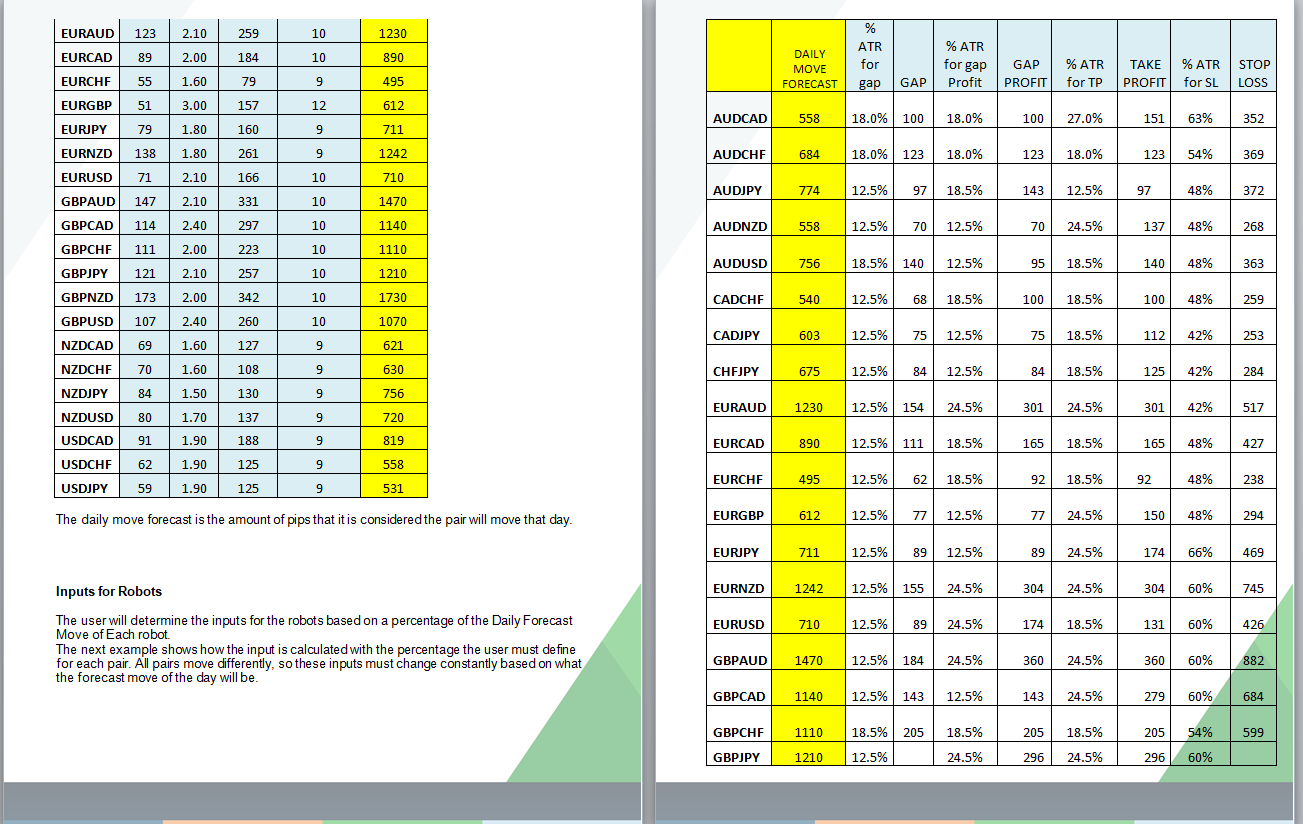
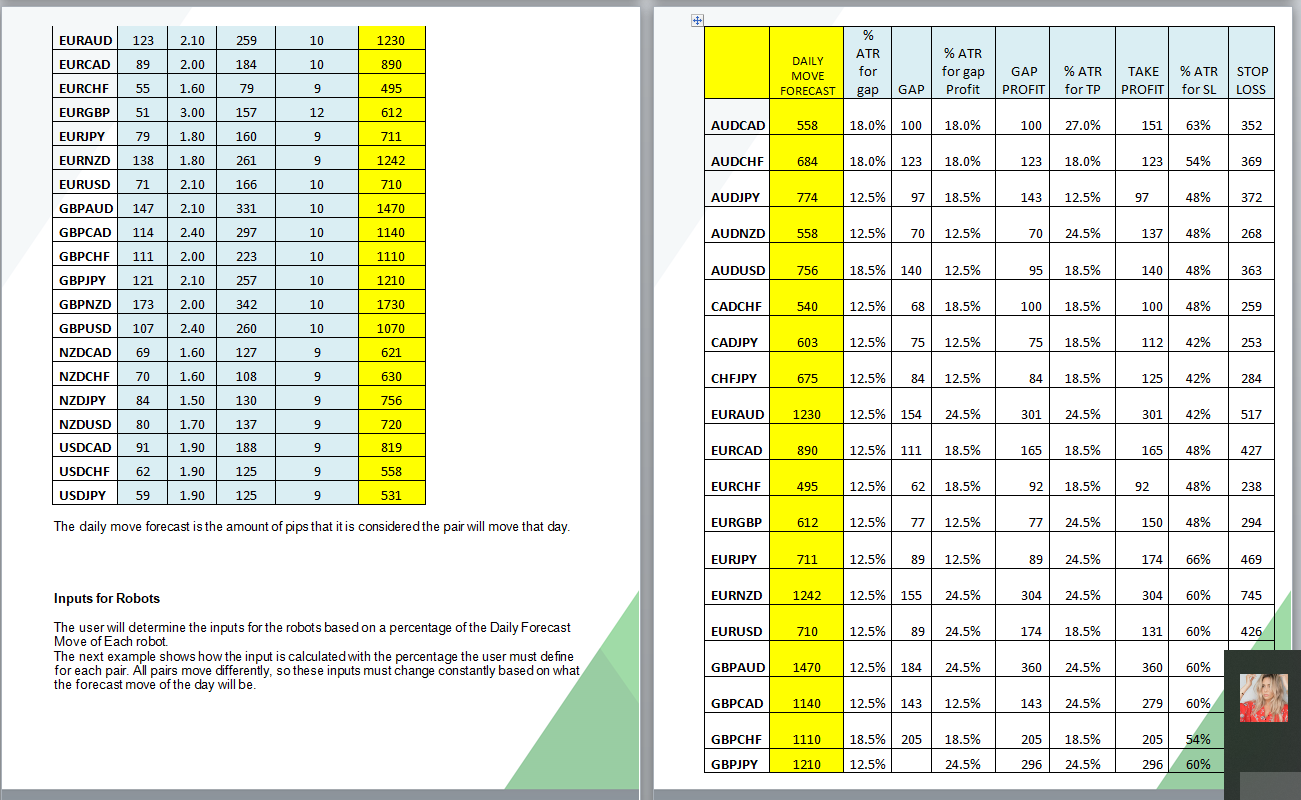
· Provide the inputs necessary for each EA (user defined) based on 2 major calculations.
· Provide a graph of the Account Equity starting from the initial balance of each day.
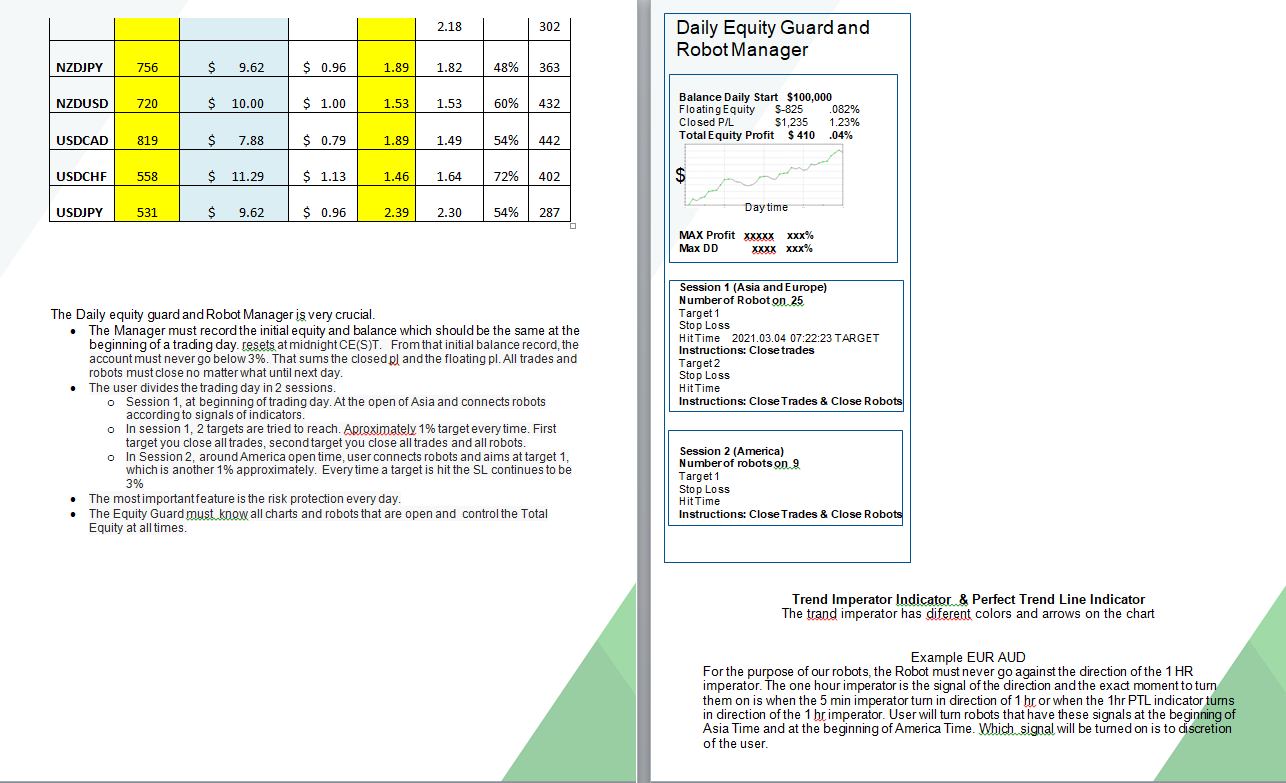
· Provide an equity guard to close trades when account targets hit as well as close robots based on account target, SL or time of day.
| GENERAL GUIDELINES | |
| The General Conditions | · Time of day and session, Real time Equity (closed p/L + current equity) · Reset Balance at start of trading day C Est midnight · Visual Dashboard with colors and information |
| Signal to Turn on Robots | Dashboard must have a blinking signal of Pairs that set up for the different user EAs. (See Fig 1) |
| · User turns on robots at beginning of ASIA session (the ones that have a signal). And the Dashboard must close trades when target 1 is hit and close all robots and trades when target 2 is hit. Or if SL is hit. · User again turns on robots at the beginning of AMERICA session (the ones that have a signal). and Dashboard closes trades and robots when target 1 hits. · User selects which robots will be turned on at his discretion.
· A long robot is setup to go long when: o 1 hr imperator is blue and o 5 min imperator is blue or PTL 1hr is blue or Imperator arrow signal is on. · A short robot is setup to go short when: o 1 hr imperator is red and o 5 min imperator is red or PTL 1hr is red or Imperator arrow signal is on. | |
| Inputs for Robots | Dashboard must show inputs for user to place in EA templates.(defined by user) (See Fig 2) |
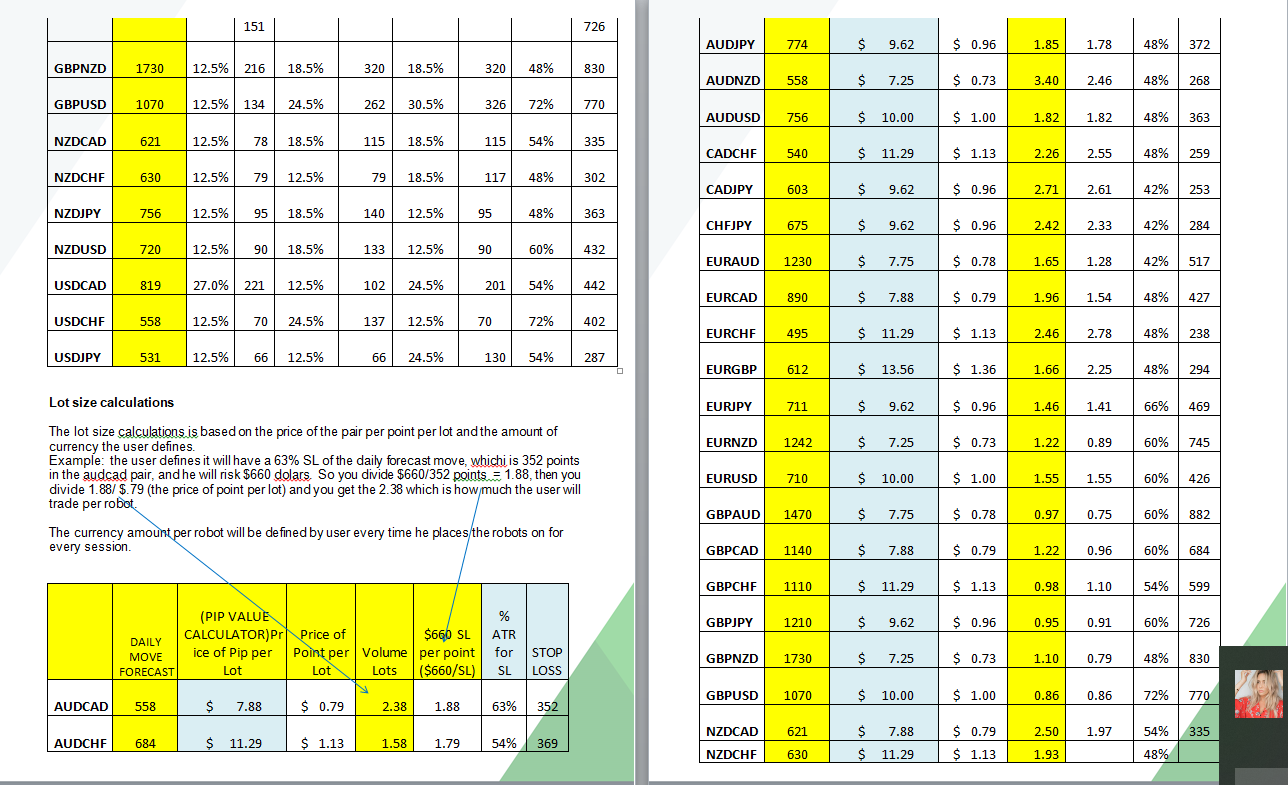
| User defined inputs for: EA.s · Name & Template · Position Volume · Profit Grid gaps · Loss Grid gaps · TP · SL | · User uses 2 EA’s (in one direction each) o Cap BB Grid EA (In 5 min charts) § Long Template § Short Template o CAP Chanel Grid EA (In 1 min charts) § Long Template § Short Template · Dashboard must calculate the inputs for the Robots based on 2 calculations: o Daily Forecast Move (Calculated with Daily ATR and Weekly ATR) See next fig.1 o Max Risk per Robot (Calculated with Max Risk in currency determined by user, price of Pair and profit per pip) See Next fig.2 |
| Daily Equity Guard & EA Manager | Dashboard must guard the realtime equity and manage robots in 2 sessions each day. (See Fig 3) |
| · Asia and London Session Targets · America session Target | · Dashboard EA must record initial daily equity at beginning of day · Dashboard must show the lowest and highest equity hit · Dashboard must graph the movement of equity for the day (Closed trades+ real time equity) · Dashboard must be able to close all trades · Dashboard must be able to close all robots · Dashboard must be able to graph the equity realtime. |
| Indicators on Charts | Indicators must plot on charts |
| Trend Imperator Indicator PTL Perfect trend line indicator |
|
|
|
|
Fig 1 Trend Imperator Color in Diferent time frames and Perfect Trend line Indicator in different time frames.