Indicators: Parabolic_HTF
newdigital, 2013.08.08 14:02
Introduction To The Parabolic SAR
In the world of short-term trading, experiences are defined by a trader's ability to anticipate a certain move in the price of a financial asset. There are many different indicators used to predict an asset's future direction, but few have proved to be as useful and easy to interpret as the parabolic SAR. In this article, we'll take a look at the basics of this indicator and show you how you can incorporate it into your trading strategy.The Indicator
The parabolic SAR is a technical indicator that is used by many traders to determine the direction of an asset's momentum and the point in time when this momentum has a higher-than-normal probability of switching directions. Sometimes known as the "stop and reversal system", the parabolic SAR was developed by the famous technician Welles Wilder, creator of the relative strength index, and it is shown as a series of dots placed either above or below an asset's price on a chart.
One of the most important aspects to keep in mind is that the positioning of the "dots" is used by traders to generate transaction signals depending on where the dot is placed relative to the asset's price. A dot placed below the price is deemed to be a bullish signal, causing traders to expect the momentum to remain in the upward direction. Conversely, a dot placed above the prices is used to illustrate that the bears are in control and that the momentum is likely to remain downward.
The first entry point on the buy side occurs when the most recent high price of an issue has been broken; it is at this time that the SAR is placed at the most recent low price. As the price of the stock rises, the dots will rise as well, first slowly and then picking up speed and accelerating with the trend. This accelerating system allows the investor to watch the trend develop and establish itself. The SAR starts to move a little faster as the trend develops and the dots soon catch up to the price action of the issue. As you can see in Figure 1, the indicator works extremely well when a stock is trending, but it can lead to many false signals when the price moves sideways or is trading in a choppy market.
Parabolic SAR and the Short Sale
The parabolic SAR is extremely valuable because it is one of the easiest methods available for strategically setting the position of a stop-loss order. As you become more acquainted with technical indicators, you'll find that the parabolic SAR has built up quite the positive reputation for its role in helping many traders lock-in paper profits that have been realized in a trending environment. You can also see that professional traders who short the market will use this indicator to help determine the time to cover their short positions.
It is important to note that this indicator is extremely mechanical and will always assume that the trader is holding a long or short position. The ability for the parabolic SAR to respond to changing conditions removes all human emotion and allows the trader to be disciplined. On the other hand, the disadvantage of using this indicator can also be seen in Figure 1. Notice how the signals can lead to many false entries during periods of consolidation. Being whipsawed in and out of trades can often be extremely frustrating, even for the most successful traders.
Figure 2, below, shows the chart of American Express (NYSE:AXP) from the last part of 2008. The trader can see no real way to get into a long position as the strong downtrend continues. This is shown by the dominance of dots placed above the price.
SAR: United It Stands
Given the mechanical properties of the parabolic SAR, it is no surprise that it is a favorite among traders who develop their own strategies. In trading, it is better to have several indicators confirm a certain signal than to solely rely on one specific indicator, so most traders will choose to compliment the SAR trading signals by using other indicators such as stochastics, moving averages, candlestick patterns etc.
For example, a reversal of the dots from below the price to above is much more convincing when the price is trading below a long-term moving average than when it occurs when the price is above the moving average. Having the price remain below a long-term moving average suggests that the sellers are in control of the direction and that the recent reversal could be the beginning of another wave lower. Furthermore, a signal is considered stronger each time that an additional indicator confirms the same trend. For example, diving into the American Express example again in Figure 3, you'll notice that the parabolic SAR indicator triggered a sell signal (black arrows) each time it neared the resistance of its 50-day moving average (green line). Traders would also take note that the stochastic oscillator crossed below its signal line around the same time as the SAR signals (shown by the red circles). The simultaneous sell signals are then used as confirmation of a move lower.
Bottom Line
The parabolic SAR is a fairly good tool for traders looking for a strategic method of gauging a stock's direction or for portioning a stop-loss order. As illustrated above, this indicator proves to be extremely valuable in trending environments, but it can often lead to many false signals during periods of consolidation. This indicator is simple to implement into any strategy, but like all indicators, it is usually best if it is used in conjunction with other indicators to ensure that all information is being considered.
newdigital, 2013.08.08 14:13
Metatrader Parabolic SAR Settings - A Simple SAR Trading SystemForex traders focus on the Parabolic SAR key points of reference, which are the “switchover” points above and below the “candlestick” formations. As with any technical indicator, a Parabolic SAR chart will never be 100% correct in the signals that it presents, but the signals are consistent enough to give a forex trader an “edge”. Skill in interpreting and understanding SAR signals must be developed over time. In the example below, let’s develop a simple trading system based on Parabolic SAR signals and alerts.
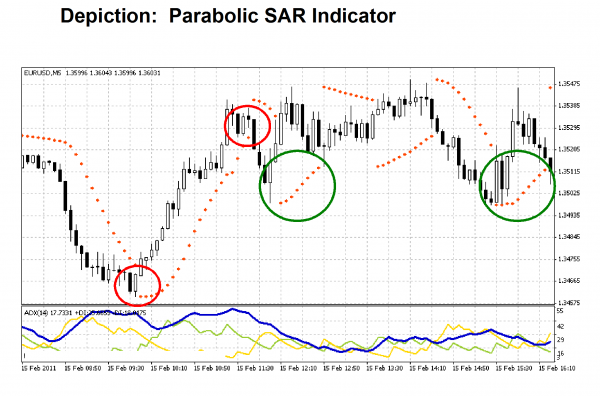
The following trading system is for educational purposes only. Technical analysis takes previous pricing behavior and attempts to forecast future prices, but, as we have all heard before, past results are no guarantee of future performance. With that disclaimer in mind, the “red” circles on the above chart illustrate optimal entry and exit points, and the “green” circles indicate false SAR signals accompanied by weak ADX readings.
A simple trading system would then be:
-
Determine your entry point after the SAR switchover for an uptrend accompanied by a strong ADX reading;
-
Execute a “Buy” order for no more than 2% to 3% of your account;
-
Place a stop-loss order at 20 “pips” below your entry point;
-
Determine your exit point when the SAR switches over at the end of the trend.
Something Interesting in Financial Video July 2013
newdigital, 2013.07.11 18:26
27. How to Trade the Parabolic SARA lesson on how to trade the Parabolic Stop and Reversal (SAR) indicator for traders of the forex, futures, and stock markets.
In our last lesson we learned about the Average Directional Index (ADX) an indicator which helps traders determine the strength of trends in the market. In today's lesson we are going to look at another indicator called the Parabolic Stop and Reversal (Parabolic SAR), which helps traders enter and manage positions when trading those trends.
The Parabolic SAR is an indicator that, like Bollinger bands is plotted on price, the general idea of which is to buy into up trends when the indicator is below price, and sell into downtrends when the indicator is above price. Once traders are in positions the indicator also assists in managing the position by providing guidance as to how one should trail their stop.
Parabolic SAR:
newdigital, 2013.03.22 14:04
PriceChannel Parabolic system basic edition
- indicators and template to download for black background (first post of this thread)
- PriceChannel indicator is on CodeBase here, same for white background, how to install
- Clock indicator to be used with this trading system - Indicator displays three variants of time in the chart: local, server and GMT
Latest version of the system with latest EAs to download
- pricechannel_parabolic_system_v1 EA
- pricechannel_parabolic_system_v1_1 EA with updated indicator
- Fully updated EA with trading system is on this post and latest indicators to download
How to trade
- tp/sl levels and timeframes
- how to trade with explanation
- graphical illustration about where to enter and where to exit with latest version of the system
- how to use AFL Winner indicator with more explanation,
- Updated manual system with templates and indicators - this post
The settingas for EAs: optimization and backtesting
- optimization results for this EA for EURUSD H4
- backtesting results for EURUSD H4 with the settings #1
- backtesting results for EURUSD H4 with the settings #2
- optimization results for EURUSD M15
- backtesting results for EURUSD M15 with the settings #1
- optimization results for GBPUSD M15
- backtesting results for GBPUSD M15 with the settings #1
Trading examples
Metaquotes demo
- MT5 statement is here
- Updated statement is here
- More trading updates
- Updated MT5 statement
- More updates
- 811 dollars for 3 trading days and final statement for scalping
GoMarkets broker, initial deposit is 1,000
- statement (77 dollars in less than 1 hour)
Alpari UK broker initial deposit is 1,000
- statement (517 dollars for one day)
RoboForex broker initial deposit is 1,000
- first statement
- updated statement (257 dollars in 2 days)
- Free trading apps
- Over 8,000 signals for copying
- Economic news for exploring financial markets
You agree to website policy and terms of use
Parabolic_HTF:
The Parabolic Sar indicator can be placed in a fixed time frame where it is calculated
Fig.1 The Parabolic_HTF indicator
Author: Nikolay Kositsin