Something Interesting in Financial Video June 2016
Economic Calendar Of The Week - May 30 - June 3, 2016
Last week Janet Yellen’s speech at Harvard was the focal point. Yellen
said that rate increases were on the horizon send the US dollar higher
while gold traded at its lowest point this year. Economic data over the
coming holiday-shortened week will provide investors with further clues
on the staying power of the US economic expansion and clues regarding
the efficacy, or not, of the most recent monetary easing undertaken in
China and in the euro area.
To take note of, in a research note sent
to clients on 26 May strategists at Bank of America-Merrill Lynch
labelled the coming month "event risk June", what with both the Bank of
Japan and US Federal Reserve set to decide on rates almost side-by-side
mid-month - with the Brexit referendum looming ever larger on the
horizon.
Against that backdrop, and following Monday´s holidays in
the UK and the US, traders will be greeted the next day by April figures
on money supply growth and credit dynamics in the Eurozone.
Data out
that same day, on industrial production and unemployment in Japan, may
also help to inform the debate regarding the need for further stimulus
measures in the world´s third largest economy. Indeed, multiple media
reports indicate that on or about the same date prime minister Shinzo
Abe may announce that consumption tax hikes due to come into effect in
April 2017 might be delayed.
ADP´s monthly payrolls report, which is
typically released on the Wednesday of each week, will be pushed out to
Thursday due to the Memorial Day holiday. Ahead of the nonfarm payroll
report due on Friday.
Manufacturing sector purchasing managers´
indices from all the major geographies, on Wednesday, and especially
from China, will also be closely monitored by markets.
Finally, OPEC is set to meet on Thursday.
The
ECB meeting is not expected to be one of the blockbuster ones, with
little change on policy expected, while the run of PMIs will be of
interest for various currency pairs.
The recent breakout in equities suggests that the post-February rally may not be done just yet, although much hinges on the outlook for Fed policy. Recent strength in the dollar has begun to shift, and if this continues equities, plus oil and other commodities, may find it easier to stage a rally.
What is Breakouts?
Breakouts are one of the most common techniques used in the market to trade. They consist of identifying a key price level and then buying or selling as the price breaks that pre-determined level. The expectation is that if the price has enough force to break the level then it will continue to move in that direction.
The concept of a breakout is relatively simple and requires a moderate understanding of support and resistance.
When the market is trending and moving strongly in one direction, breakout trading ensures that you never miss the move.
Generally, breakouts are used when the market is already at or near the extreme high / lows of the recent past. The expectation is that the price will continue moving with the trend and actually break the extreme high and continue. With this in mind, to effectively take the trade we simply need to place an order just above the high or just below the low so that the trade automatically gets entered when the price moves. These are called limit orders.
It is very important to avoid trading breakouts when the market is not trending because this will result in false trades that result in losses. The reason for these losses is that the market does not have the momentum to continue the move beyond the extreme highs and lows. When the price hits these areas, it usually then drops back down into the previous range, resulting in losses for any traders trying to hold in the direction of the move.
What Are Retracements?
Retracements require a slightly different skill set and revolve around the trader identifying a clear direction for the price to move in and become confident that the price will continue moving in. This strategy is based on the fact that after each move in the expected direction, the price will temporarily reverse as traders take their profits and novice participants attempt to trade in the opposite direction. These pull backs or retracements actually offer professional traders with a much better price at which to enter in the original direction just before the continuation of the move.
When trading retracements support and resistance is also used, as with break outs. Fundamental analysis is also crucial to this type of trading.
When the initial move has taken place traders will be aware of the various price levels that have already been breached in the original move. They pay particular attention to key levels of Support and Resistance and areas on the price chart such as ‘00’ levels. These are the levels that they will look to buy or sell from later on.
Retracements are only used by traders during times when short term sentiment is altered by economic events and news. This news can cause temporary shocks to the market which result in these retracements against the direction of the original move.
The initial reasons for the move may still be in place but the short term event may cause investors to become nervous and take their profits, which in turn causes the retracement. Because the initial conditions remain this then offers other professional investors an opportunity to get back into the move at a better price, which they very often do.
Retracement trading is generally ineffective when there are no clear fundamental reasons for the move in the first place. Therefore, if you see a large move but cannot identify a clear fundamental reason for this move the direction can change quickly and what seems to be a retracement can actually turn out to be a new move in the opposite direction. This will result in losses for anyone trying to trade in line with the original move.
What Are Reversals?
Reversals are generally used by technical based traders during times of
little fundamental activity. At these times the markets tend to ‘range’
or move sideways with no clear direction. Traders look for key price
levels that they can use to trade directly from in expectation of a
‘bounce’ when price hits it. These bounces provide small, quick
opportunities to take a profit from low volume market activity.
Again,
the tools used for reversal trading are almost identical to those used
in the previous strategies and include support and resistance and
fundamental analysis.
Before trading reversals, you must be sure that
there is no major news expected to be released during that session, and
that no key monetary policy makers are speaking or making comments to
the press. These events can trigger moves that will result in losses on
your short term trading.
Once the fundamental picture is clear, we
then need to focus on the technical analysis and in particular the
support and resistance levels that are near the current price.
Common
levels used by traders with this type of strategy include, old highs
and lows from previous trading sessions, Pivot point levels, Fibonacci
levels and areas at which all three of these levels overlap. These
overlaps are known as confluences, and these provide excellent areas at
which to look for the price to bounce from during the session.
The
reactions vary but very often traders will be looking for only a few
pips of profit from these reactions, rather than attempting to hold the
positions over several trading sessions.
Trading reversals is strictly for times when the market is not trending in a clear direction, and should not be employed blindly during all market sessions as this will dramatically increase the amount of losses you suffer.
Economic Calendar Of The Week - June 6-10, 2016
In the wake of the latest much weaker-than-expected US jobs report, the
focus in the coming week would likely be on US Federal Reserve chair
Janet Yellen´s speech on Monday. For some economists, May´s US non-farm
payrolls report flagged the risk of that country possibly slipping into a
so-called 'technical recession' in just over one year´s time. The
dollar crashed on the NFP in a week that was tense until this big event.
Speeches this week by Janet Yellen and Mario Draghi, Australian and New
Zealand’s rate decisions stand out now.
Against that backdrop, traders would also be waiting on a steady trickle of economic releases from the People´s Republic of China, including the latest foreign exchange reserves data (Monday), foreign trade numbers (on Wednesday), CPI and PPI (on Thursday) and figures on industrial production and investment in two Sundays´ time.
A barrage of tier-one Japanese indicators on the country´s current account, foreign trade and gross domestic product - on Wednesday - might also help shape expectations for Tokyo´s next policy steps, especially those of the Bank of Japan.
Significantly, both Australia and New Zealand´s central banks were set to announce their latest policy decisions on Tuesday and Wednesday, respectively. Data on industrial production were also set for release in the UK, France and Italy.
On Monday Federal Reserve Chair Janet Yellen will give a talk about the economic outlook and monetary policy in Philadelphia. Yellen may address the recent plunge in the US employment report and give clues about the Fed’s monetary policy intentions in the coming weeks. Market volatility is expected.
Tuesday’s big event is the Reserve Bank of Australia rate decision. The RBA cut its official cash rate by 25 basis points in May reaching a historic low of 1.75 %. This was the first change since May 2015, when rates were cut 25 basis points to 2%. The rate cut took the market by surprise. RBA Governor Glenn Stevens said weak inflation was the main reason for this move. Stevens also noted that global economic continued to grow at a slower pace than expected.
Wednesday starts out with China, the world’s second largest economy has been worrying markets for quite some time with lower economic activity. The bottom line figure of the trade balance report is less important than the changes in imports and exports. Higher levels on both figures is good news for the world and a more “risk on” atmosphere which is favorable for commodity currencies. And a drop in exports and imports is negative.
Following Tuesday RBA
decision comes its cousin the RBNZ. The Reserve Bank of New Zealand
kept interest rates on hold in April, the decision was in line with
market forecast. The bank stated that further policy easing may be
required to ensure the pace of inflation reaches the middle of the
target range. Global growth outlook remained a concern mainly due to
weaker economic activity in China and other emerging markets. Domestic
economy is reliant on strong inward migration construction activity,
tourism and an accommodative policy. Inflation remains weak mostly due
to low energy and import prices.
ECB President Mario Draghi will
speak at the Brussels Economic Forum on Thursday. After keeping rates
unchanged in June, Draghi asked for patience saying the balance of
economic risks has improved after the recent monetary policy measures
taken. Market volatility is expected.
Forum on trading, automated trading systems and testing trading strategies
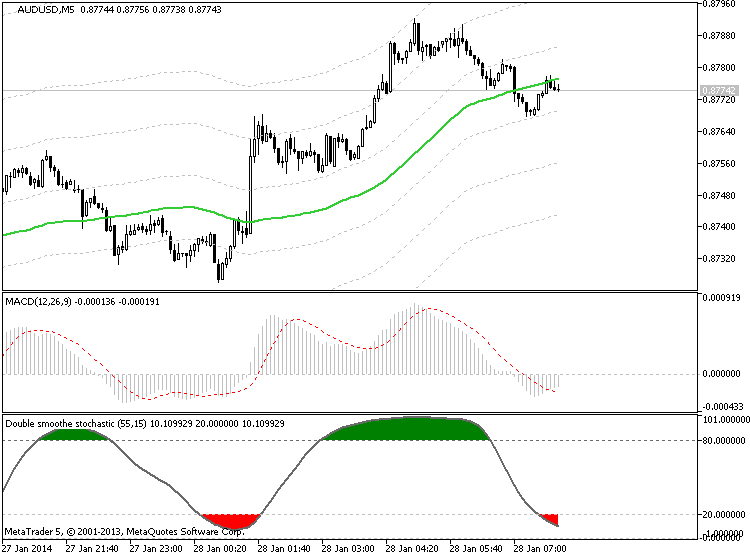
Sergey Golubev, 2014.01.28 07:59
What is the MACD Indicator? How do I use it? (based on dailyforex article)
One of the most common technical indicators that is used by day traders in the financial markets can be seen in the Moving Average Convergence Divergence -- more commonly referred to as the MACD. But one mistake that many new traders make is that they will simply start using this indicator without really understanding how it functions or makes its calculations. This can lead to costly mistakes that should have been completely avoidable. So, it makes sense to study the logic and calculations behind the MACD (and all other indicators) in order to more accurately configure your day trading positions and generate gains on a consistent basis.
The Moving Average Convergence Divergence (MACD) Defined
Anyone with any experience in the forex markets and in technical
analysis strategies has likely heard a great deal about the Moving
Average Convergence Divergence (MACD). But what exactly does the MACD
tell us -- and how is it calculated? Without an understanding of these
areas, it can be difficult to see trading signals as they emerge. Here,
will deconstruct the MACD indicator and explain how and why it is
commonly used.
“In its most basic form,” said Haris Constantinou, markets analyst, “the
MACD is a momentum indicator that is designed to follow existing trends
and find new ones.” The MACD does this by showing the differences and
relationships between a two-level combination of moving averages and
price activity itself.
MACD Calculations
To determine and calculate the MACD, we must subtract a 26 period
Exponential Moving Average (EMA) from a 12 period EMA. Then, a 9 period
EMA of the MACD is plotted, and this becomes the Signal Line for the
indicator. The Signal Line is plotted over the MACD and this will be
used as the trigger reading for trading signals (both buy signals and
sell signals). These elements form the basis of the MACD construction,
and it is important to have a strong understanding of these elements if
you plan on using the indicator in your daily trading.
Three Common Approaches to the MACD
Now that we understand the basics of how the MACD is calculated, it is a
good idea to look at some of the common ways that the MACD is viewed by
traders so that we can get a sense of how exactly the indicator is used
to identify trading opportunities. There are a few different ways the
indicator can be interpreted, and the three of the most common methods
proven to be the most effective for traders include
- Crossovers,
- Divergences,
- and in identifying Overbought / Oversold conditions
Forum on trading, automated trading systems and testing trading strategies
Something Interesting in Financial Video April 2014
Sergey Golubev, 2014.04.02 08:47
Technical Analysis Indicator MACD part one
Most technical analysis indicators are lagging. Let show you how to use MACD properly and its Leading indicator values.
MACD Oscillator Technical Analysis Fast Line and Signal Line
MACD is used in various ways to give technical analysis information.
- center line crosses indicate bullish or bearish markets; below zero is bearish, above zero is bullish.
- MACD crossovers indicate a buy or sell signal.
- MACD oscillations can be used to indicate oversold and overbought regions
- Used to look for divergence between price and indicator.
MACD Construction
The MACD is constructed using two exponential moving averages and MACD indicator plots two lines. The two default exponential moving averages used are 12 and 26. Then a smoothing factor of 9 is also applied when drawing.
Summary of how MACD is plotted
MACD uses 2 EMAs + a smoothing factor (12, 26 Exponential Moving Averages and 9 smoothing periods)
MACD only plots two lines- the fast line and the signal line
- The Fast Line is the difference between the 26 EMA and 12 EMA
- The signal line is the 9 period moving average of the MACD fast line.
Implementation
The MACD indicator implements the MACD line as a continuous line while the signal line is implemented as a histogram.
The fast line and signal line is used to generate trading signals using the crossover method.
There is also the center-line which is also known as the zero mark and it is a neutral point between buyers and sellers.
Values above the center-mark are considered bullish while those below are bearish.
The MACD being an oscillator indicator, oscillates above and below this center line.
Forum on trading, automated trading systems and testing trading strategies
Something Interesting in Financial Video April 2014
Sergey Golubev, 2014.04.02 08:51
Technical Analysis Indicator MACD part twoPart two of the three part series on MACD
Forum on trading, automated trading systems and testing trading strategies
Something Interesting in Financial Video April 2014
Sergey Golubev, 2014.04.02 08:57
Technical Analysis Indicator MACD part three
The final wrap up in the three part series on MACD
Forum on trading, automated trading systems and testing trading strategies
moving average of oscillator(OsMA)
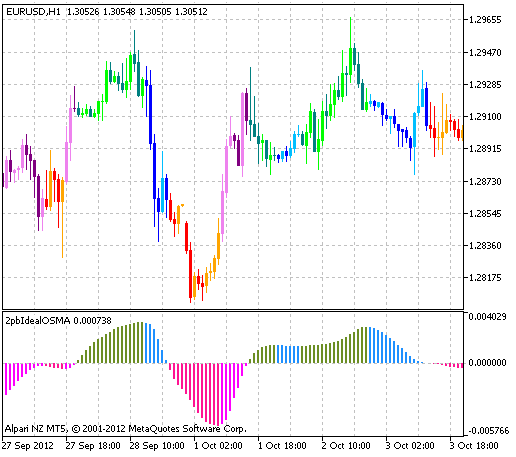
Sergey Golubev, 2016.06.10 17:59
Moving Average of Oscillator (OsMA) - indicator for MetaTrader 5
OSMA = MACD - SIGNAL
Moving Average of Oscillator (OsMA) is the difference between the oscillator and oscillator smoothing.
In this case, the base line of Moving Average Convergence/Divergence (MACD) is used as the oscillator, and the signal line is used as the smoothing.
====
2pbIdealXOSMA_Candles - indicator for MetaTrader 5
This indicator draws candlesticks in accordance with the color of the bars in histogram of the 2pbIdealXOSMA indicator. Growing candlesticks are colored in light colors, falling are colored in the dark colors
====
OsMA. OsMA Divergence - indicator for MetaTrader 4
====
Standard OsMA indicator - indicator for MetaTrader 4
====
The function returns the handle of the Moving Average of Oscillator indicator. The OsMA oscillator shows the difference between values of MACD and its signal line. It has only one buffer.
int  iOsMA(
   string              symbol,              // symbol name
   ENUM_TIMEFRAMES     period,              // period
   int                 fast_ema_period,     // period for Fast Moving Average
   int                 slow_ema_period,     // period for Slow Moving Average
   int                 signal_period,       // averaging period for their difference
   ENUM_APPLIED_PRICE  applied_price        // type of price or handle
   );
What is OsMA indicator?
The oscillator of moving average known as OsMA, is an indicator that shows the momentum of price action. It is calculated by taking the difference between a shorter-term moving average and a longer-term moving average.
The two most common are the 12 period moving average and the 26 period moving averages. Because of this, it is best described as a modification of the MACD indicator.
A cross through the zero or center line can be a very simple way to decide if momentum is gaining to the bullish side, or if it is falling to the bearish side. Traders will use the side of the line that the histogram is on to help them decide which direction they want to be in a particular market.
The
OsMA essentially indicates when a security is overbought or oversold, or
when a new trend is forming. If OsMA stops decreasing and starts
increasing, it is the signal for buying. If OsMA ceases increasing and
starts decreasing its' the signal for sale. The discrepancy of the price
and OsMA is a trustworthy signal.
Forum on trading, automated trading systems and testing trading strategies
Mathematical Proof For Robo Traders :-) Watch from 42:42
PCWalker, 2016.06.11 08:56
Everyone that want some mathematical proof for your robo traders, should watch the following and start studying your dream job into financial wisdom of high skies flyers.
Forum on trading, automated trading systems and testing trading strategies
Mathematical Proof For Robo Traders :-) Watch from 42:42
Daniel Stein, 2016.06.11 11:57
here is the complete list:
- Free trading apps
- Over 8,000 signals for copying
- Economic news for exploring financial markets
You agree to website policy and terms of use
Please upload forex video you consider as interesting one. No direct advertising and no offtopic please.
The comments without video will be deleted.