moving average of oscillator(OsMA)
- Indicators: Moving Average of Oscillator, OsMA
- Indicators: Moving Average of Oscillator (OsMA)
- please suggest a good oscillator
Moving Average of Oscillator (OsMA) - indicator for MetaTrader 5
OSMA = MACD - SIGNAL
Moving Average of Oscillator (OsMA) is the difference between the oscillator and oscillator smoothing.
In this case, the base line of Moving Average Convergence/Divergence (MACD) is used as the oscillator, and the signal line is used as the smoothing.
====
2pbIdealXOSMA_Candles - indicator for MetaTrader 5
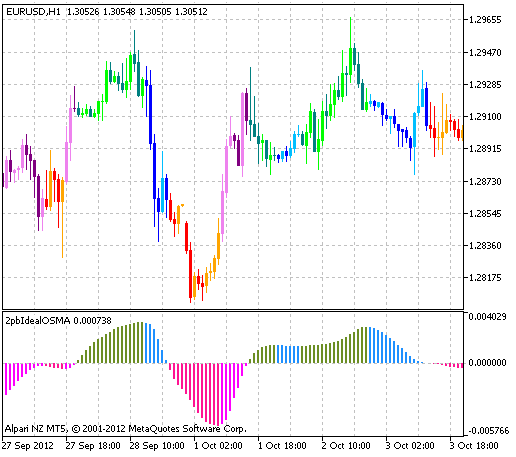
This indicator draws candlesticks in accordance with the color of the bars in histogram of the 2pbIdealXOSMA indicator. Growing candlesticks are colored in light colors, falling are colored in the dark colors
====
OsMA. OsMA Divergence - indicator for MetaTrader 4
====
Standard OsMA indicator - indicator for MetaTrader 4
====
The function returns the handle of the Moving Average of Oscillator indicator. The OsMA oscillator shows the difference between values of MACD and its signal line. It has only one buffer.
int  iOsMA(
   string              symbol,              // symbol name
   ENUM_TIMEFRAMES     period,              // period
   int                 fast_ema_period,     // period for Fast Moving Average
   int                 slow_ema_period,     // period for Slow Moving Average
   int                 signal_period,       // averaging period for their difference
   ENUM_APPLIED_PRICE  applied_price        // type of price or handle
   );
Forum on trading, automated trading systems and testing trading strategies
Something Interesting in Financial Video June 2016
Sergey Golubev, 2016.06.10 18:05
What is OsMA indicator?
The oscillator of moving average known as OsMA, is an indicator that shows the momentum of price action. It is calculated by taking the difference between a shorter-term moving average and a longer-term moving average.
The two most common are the 12 period moving average and the 26 period moving averages. Because of this, it is best described as a modification of the MACD indicator.
A cross through the zero or center line can be a very simple way to decide if momentum is gaining to the bullish side, or if it is falling to the bearish side. Traders will use the side of the line that the histogram is on to help them decide which direction they want to be in a particular market.
The
OsMA essentially indicates when a security is overbought or oversold, or
when a new trend is forming. If OsMA stops decreasing and starts
increasing, it is the signal for buying. If OsMA ceases increasing and
starts decreasing its' the signal for sale. The discrepancy of the price
and OsMA is a trustworthy signal.
OsMA Color - indicator for MetaTrader 5
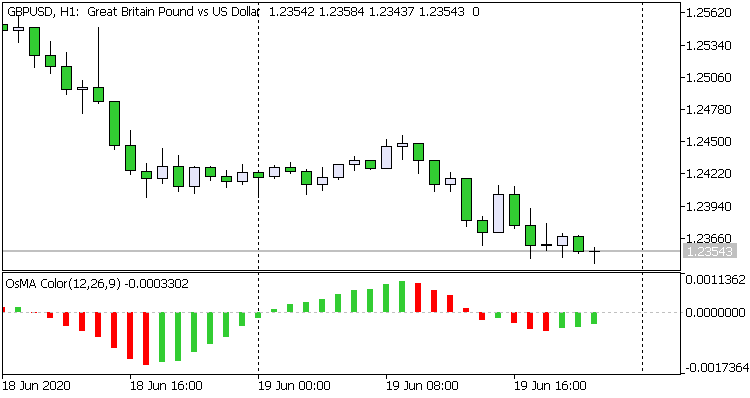
Add a little 'animation' to the iOsMA indicator (Moving Average of Oscillator, OsMA) - now the indicator is displayed based on the drawing style DRAW_COLOR_HISTOGRAM
MACD_Osmax - indicator for MetaTrader 5

Oscillating indicator MACD OsmaX is a modification of the classical MACD.
Calculations:
MACD = FastMA - SlowMA
Signal = AvgMACD
OsMA =(MACD - Signal) * OsmaX

- Free trading apps
- Over 8,000 signals for copying
- Economic news for exploring financial markets
You agree to website policy and terms of use