Repetitive patterns and other patterns
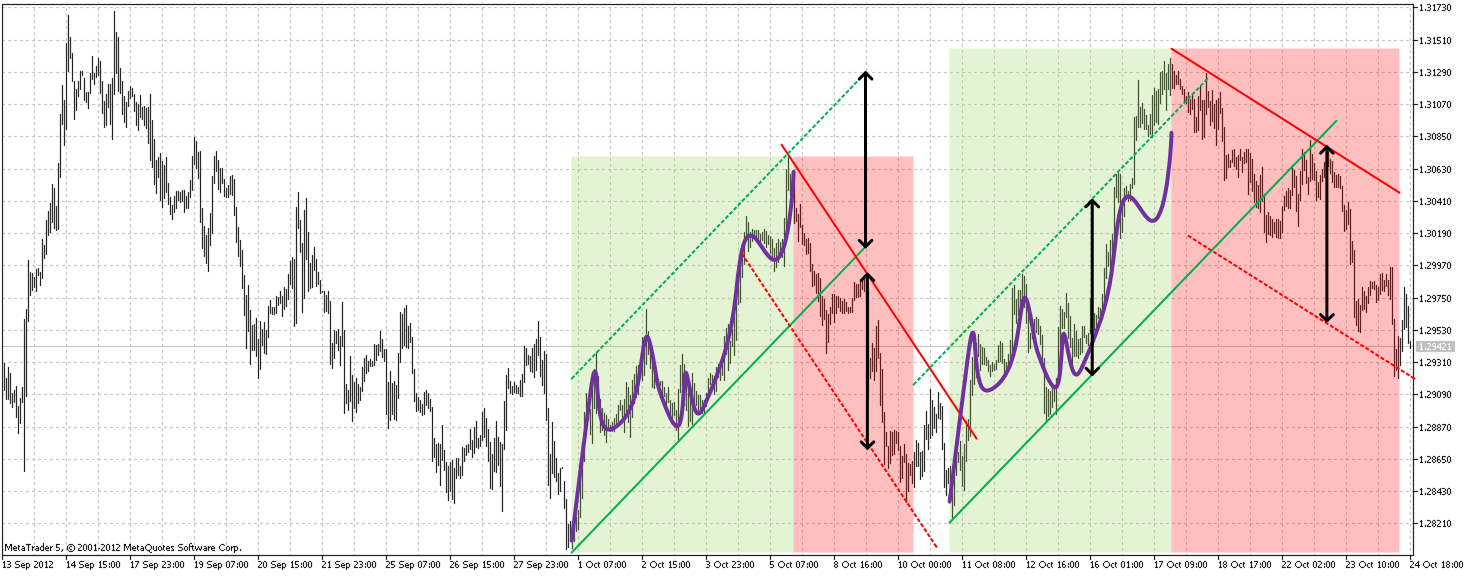
Looking for further patterns: build price channels and measure their width along the price axis. The width is marked with a black arrow. Compare the width of the 4 channels (two green and two red) - the width is the same! So, supporters of the efficient market, what do you think? Is it an accident or a regularity? Proponents of neural networks: could the network find these patterns on its own?
Looking for further patterns: build price channels and measure their width along the price axis. The width is marked with a black arrow. Compare the width of the 4 channels (two green and two red) - the width is the same! So, supporters of the efficient market, what do you think? Is it an accident or a regularity? Proponents of neural networks: could the network find these patterns on its own?
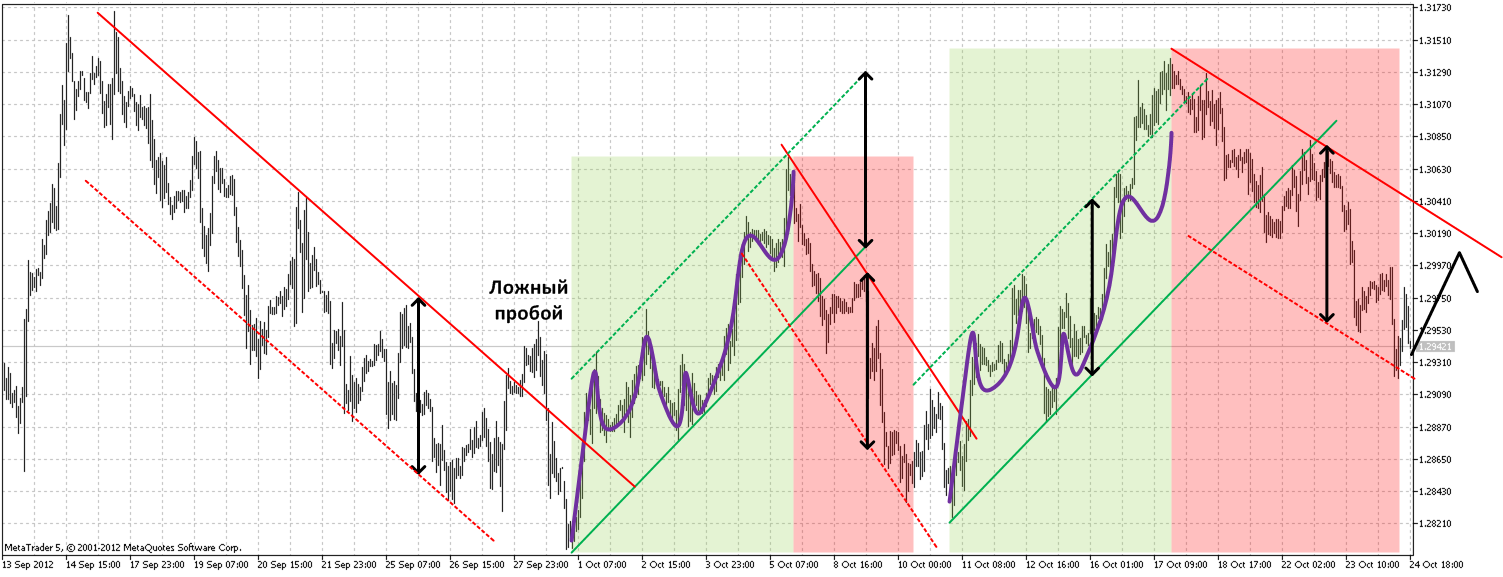
There are plenty of "patterns" to be found in history. The problem is that you can only determine the similarity to something after the whole pattern has already been drawn. But then it becomes useless, because from the moment of drawing it has become a property of historical data. How do we determine which pattern will be next, after the last identified one? For example, looking at the left part of the chart, where the patterns have not yet been coloured, we cannot define where the growth or decline will end, i.e. the line between red and green should pass, because the patterns there are not similar to their right side congeners and we cannot see any "patterns" there. It turns out that there are pseudo regularities in the right part, i.e. the curves turned out to be more or less similar to each other at random.
There are plenty of "patterns" to be found in the story. The problem is that you can only identify similarities with something once the entire pattern has been drawn. But then it becomes useless, because from the moment of drawing it has become a property of historical data. How do we determine which pattern will be next, after the last identified one? For example, looking at the left part of the chart, where the patterns have not yet been coloured, we cannot define where the growth or decline will end, i.e. the line between red and green should pass, because the patterns there are not similar to their right side congeners and we cannot see any "patterns" there. It turns out that there are pseudo regularities in the right part, i.e. the curves turned out to be more or less similar to each other at random.
Let's do a simple experiment. The last red pattern has not yet ended. I'll argue that it will repeat the first red pattern. Namely, I expect a pullback from the lower boundary to the upper boundary, in the range of 1.300, as shown in the black zigzag in the picture below. Please show your prediction to the net.
If you flip the last red one, you can see the pattern, too.
I've been thinking about how to teach the network to recognise patterns for a long time, the most logical thing I could think of was creating copies stretched along the verticle and horizontally, then comparing them with the network.
If you flip the last red one, you can see the pattern, too.
I've been thinking about how to teach the network to recognise patterns for a long time, the most logical thing I could think of was creating copies stretched along the verticle and horizontally, then comparing them with the network.
Very interesting! The reversed last red pattern is very similar to the first green one. Expect a change in trend.
joo:
Известно, что сеть, обученная на данных, специально искусственно зашумлённых, справляется с новыми данными (уже без искусственно наложенного шума) гораздо лучше. Так может быть стоит "шуметь" и портить примеры?
с возвращением. :)
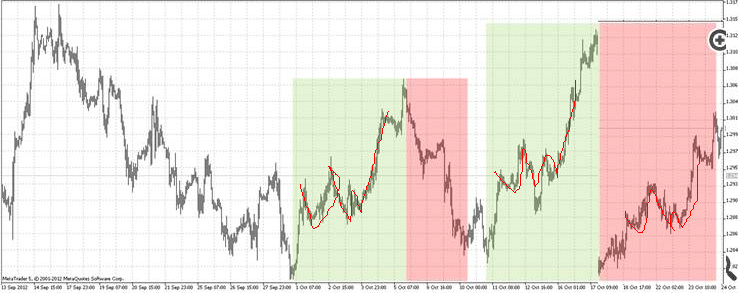
Nah, I haven't gone back to the nets yet. There is a repeating pattern inside a trend channel. Before forex, I used this pattern in manual trading on the stock market. But then I got into automation and nets. To recognize this pattern, nets will not help. The pattern is very crooked. You need to be able to identify the key points, which I will talk about later.
........To recognise this pattern, the nets are no help. The pattern is very warped. ..........
Here are my observations when working with channels (worked in the stock market, should work in forex):
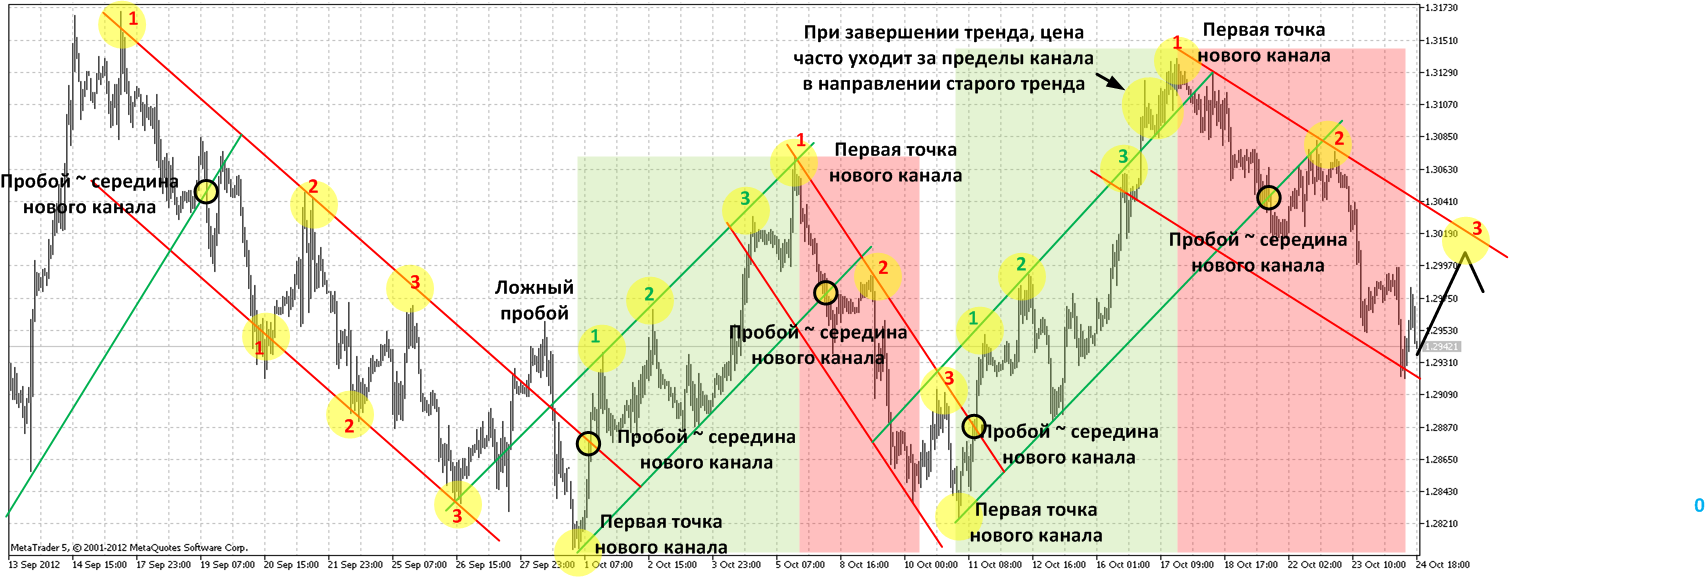
- The breakdown point of the previous channel usually becomes the midpoint of the new channel.
- The top of the previous trend becomes the first tangent of the new channel.
- The width of the new channel is usually equal to the width of the previous channel, but not always.
- From prerequisites 1, 2 and 3, a new channel may be built before it has even formed. This will give us the expected entry and exit points.
- The channel usually lasts until price touches one of its borders 3 times. Only such touches between which price reaches the middle of the channel are considered. After 3 touches of the same border, we expect either an opposite trend or flat. Occasionally, upon breaking the old channel, a new channel may be formed in the direction of the old trend, usually parallel to the old channel.
- When a trend ends, price often moves out of the channel in the direction of the trend.
- It is better to trade on the reflection from the border in the direction of the trend (the second tangent of the down-trend border, the second or third tangent of the upper down-trend border). Other strategies are also possible.
Who will program this interestingness?
- Free trading apps
- Over 8,000 signals for copying
- Economic news for exploring financial markets
You agree to website policy and terms of use
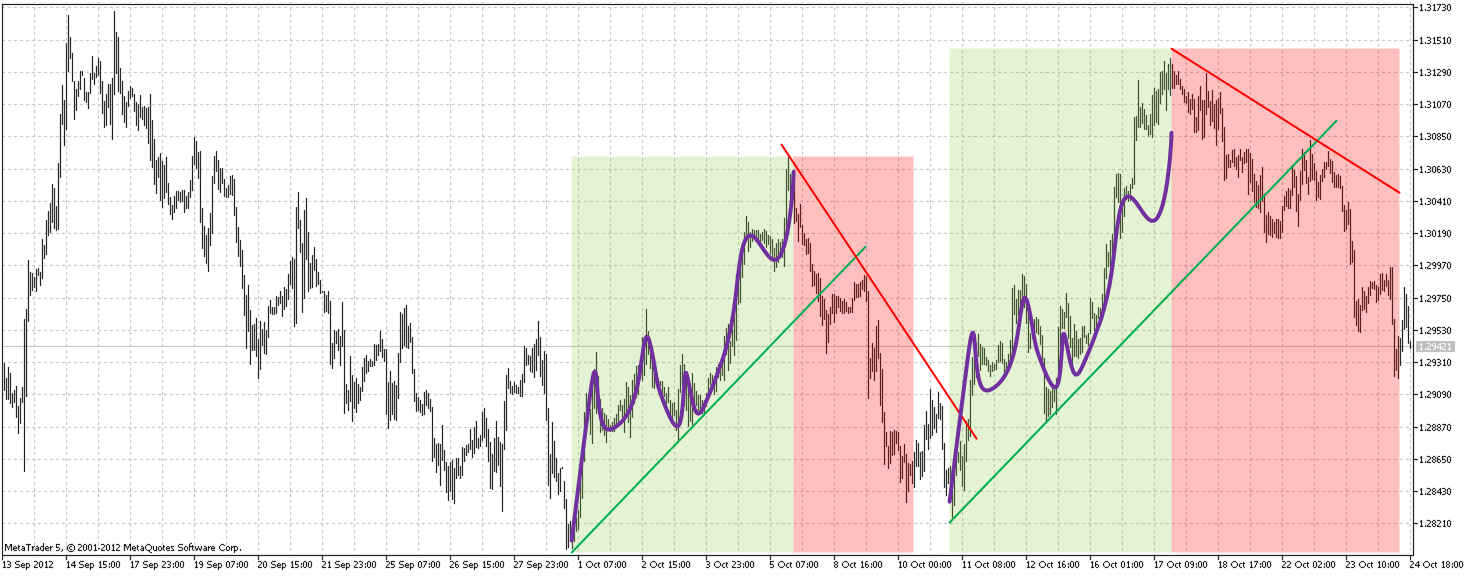
This isn't the first time I've seen recurring patterns, not from deep history, but from the brief past. Here is one example:
Notice how similar the green patterns are. The time difference between them is only a week and a half. Both of the green up-trend patterns ended up being down-trend patterns. We could have detected by eye the similarity of the green patterns and opened a short position at the end of the second green pattern. Question: how do we do that automatically? I have already tried a probability net. The problem with that network is that it is very sensitive to pattern distortions. For example, two red patterns seem to be the same to the eye but the second one is spread almost twice as long as the first one. The movement along the price axis is also different in amplitude. If we try to take the zigzag tops, one pattern will have more tops than the other and the net will get jammed. Thoughts?