A question for an Expert Technical Analyst
- How to use Support and Resistance Effectively - the forum thread
- Support and Resistance - CodeBase
- An indicator of support and resistance levels - CodeBase
- Specific support and resistance indicator - CodeBase
- and more here in search
more to follow ...
Forum on trading, automated trading systems and testing trading strategies
Scripts: Drag and Drop Support and Resistance lines with color differentiation
Sergey Golubev, 2014.06.11 14:17
Static Support and Resistance in the Forex Market (based on dailyfx article)
- Traders can use support and resistance to grade market conditions, define trends, and enter positions.
- We discuss ‘static’ methods of support and resistance in the below article.
- We delve into pivot points, and psychological support/resistance analysis
After all, if price has hit a floor with which it may have difficulty breaking through (support) or a ceiling with which it may not be able to rise above (resistance); this can offer a plethora of trade ideas and setups.
Unfortunately, most new traders learn one or two ways of identifying support or resistance; and when they see that it doesn’t work all-of-the-time, they abandon such studies in hopes of finding ‘holy grails’ elsewhere.
Well, holy grails don’t really exist. It often takes the new trader some time to learn this lesson the hard way: There is no strategy or approach or indicator that will allow a trader to always win, no matter how strong the analytical method being employed. Rather, trading is about probabilities and attempting to get them on your side or in your favor as much as humanely possible using this analysis.
Support and resistance has a special role in this analysis. It can be used to grade market conditions, determine trends, identify entry and exit points along with a bevy of other options.
Pivot Points
This is one of the more common mannerisms of identifying support and resistance, and it’s also one of the oldest. Pivot points originated before computers became common in financial markets as floor traders need a quick and easy way to see if prices were ‘cheap’ or ‘expensive.’
So these floor traders developed a short-hand manner of getting support (cheap) and resistance (expensive) levels.
These floor traders would take the previous day’s high, low, and closing prices and would average these
values together to find the ‘pivot’ for the next trading day. Price action trading above this pivot would be ‘bullish’ while prices below would be ‘bearish.’
While this is fine and good, it doesn’t tell us much about support or resistance yet; so to take this a step further, traders would then multiply the pivot by two, and would then subtract the previous day’s low to get the first level of resistance (R1). They can then do the same to find the first level of support (S1), multiplying the pivot value times two and then subtracting the previous day’s high.
After the R1 and S1 values are solved, traders can then move on to the next levels of support and resistance. To find the second level of resistance (R2), traders can add the pivot value to the difference between R1 and S1; and the second level of support could be found by subtracting the difference between R1 and S1 from the pivot value. The full equation is below:
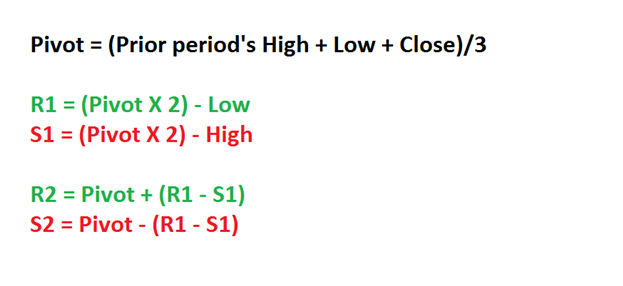
As you can see from the equation, pivot points use very basic math to find potential support and resistance levels. Luckily for traders, most charting packages will automatically do this math for us while plotting the support and resistance levels at appropriate intervals.
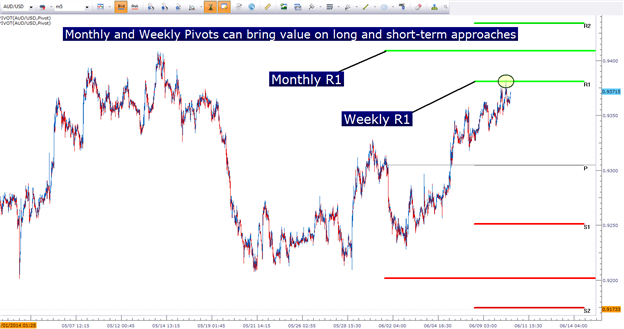
Pivot Points can be generated for a variety of time frames, and the longer-term pivots will often work best as more traders may be seeing and reacting to those levels.
As with most forms of technical analysis, the longer the term being used in the analysis the stronger the response that may be elicited. Pivot points of monthly and weekly flavors will often attract significant interest, and should be followed by traders even if using shorter-term hourly and four-hour charts.
Monthly and Weekly Pivot Points can bring value on long as well as short time frames
Psychological Levels
One of the most alluring aspects of technical analysis is the ability of
statistics and mathematics to show patterns in human behavior. Nowhere
is this more prominent than in the study of ‘psychological’ levels in
financial markets.
Most human beings think in even rounded whole numbers. We can’t help it;
our species has evolved to value simplicity. As an example, ask someone
how much they paid for their car or their jacket, or even their latte.
They’ll likely round their answer up (or down) to the nearest round
number. This type of rounding will often happen in markets as well; as
traders place their stops or entry orders at or around these levels in
the same way that most human beings will respond when asked how much
they paid for their coffee.
GBPUSD Weekly chart with ‘Major,’ and ‘Less Major’ levels identified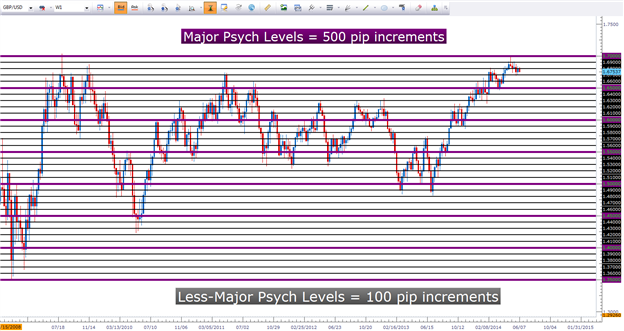
As you can see, these levels can come up quite often in a market,
particularly during strong trends as new prices run into fresh
resistance levels (or support levels in the case of a down-trend).
This study of support and resistance can be taken a step further with
the ‘minor’ prices that are set in 25-pip increments; known as the
‘minor’ psychological levels. In the chart below, we’ve moved down to
the hourly chart in the same market looked at above (GBPUSD) with the
addition of these more granular ‘minor’ levels:
Hourly GBPUSD with Minor psychological levels added (25-pip increments)
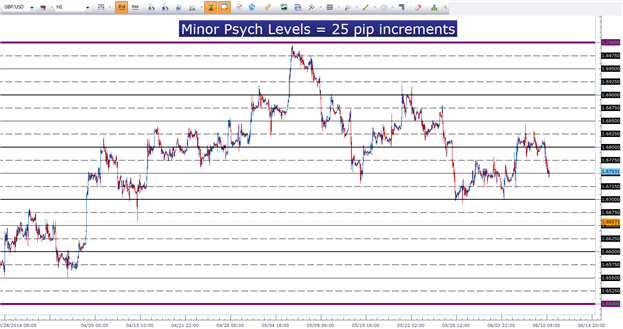
With psychological levels taking place every 25 pips, there are numerous
opportunities for traders to ‘catch swings’ in a market.
To put more power behind psychological levels or pivot points, traders
can look for confluence amongst these analytical methods; including the
dynamic support and resistance mechanisms that we’ll investigate in our
next installment.
Market Condition Evaluation (2 EAs were created)
-------------
Forum on trading, automated trading systems and testing trading strategies
Market Condition Evaluation based on standard indicators in Metatrader 5
Sergey Golubev, 2013.09.01 21:06
This my post? red dotted lines are for possible sell stop trade, blue dotted lines are are possible buy stop ...
=============
Anyway - I just copied some latest summary from this thread :
=============
Market Condition Evaluation
story/thread was started from here/different thread
================================
The beginning:
- Market condition indicators/tools thread
- MaksiGen Trading system (light Paramon): many variations of the system - the thread
- How to use Support and Resistance Effectively - educational thread
- Market condition and EAs thread
- Trend indicators thread
- Forex Market Conditions, a graphic depiction - the thread
- Evaluation of the market condition using six SMA indicators thread
- Multi-indics indicators thread
- Candle time tools thread
================================
Market condition
- the theory with examples (primary trend, secondary trend) - read staring from this post till this one
- Summary about market condition theory is on this post
- Practical examples about every market condition case by indicators: starting from this page till this one
- trendstrength_v2 indicator is here,
- AbsoluteStrength indicator new version is here
- AbsoluteStrength indicator old version is on this post
- AbsoluteStrengthMarket indicator is here to download.
- good feature in Metatrader 5: moving stop loss/take profit by mouse on the chart (video about howto)
- predictions are very different thing from technical/fundamental analytsis the post with explanation
- Technical vs. Fundamental; Short-Term vs. Medium-Term vs. Long-Term; Discretionary vs. Automated - the post
- Market condition setup (indicators and template) is here
================================
3 Stoch MaFibo trading system for M5 and M1 timeframe
- trading examples
- template to download
- explanation how to trade and more explanation here
- how to install
- 2stochm_v4 EA is on this post.
================================
PriceChannel ColorPar Ichi system.
================================
MaksiGen trading system
- indicator to download
- some explanation about the system in general how to use
- Trading examples with MT5 statement, more trading is here.
- Paramon trading system iis on this post; How to trade the system - manual trading with live examples - read this page.
================================
Merrill's patterns are on this page.
================================
Divergence - how to use, explanation and where to read about.
================================
Scalp_net trading system
- template/indicators and how to use are on this comment.
- scalp_net_v132_tf EA is on this post with optimization results/settings for EURUSD M5 timeframe
- possible settings #1 for this EA for EURUSD M5 timeframe with backtesting results is on this post.
================================
MTF systems
more to follow ...
================================
MA Channel Stochastic system is here.
================================
Ichimoku
The beginning
After
- The theory of the signals
- Ichimoku alert indicator with arrows
- Ichimoku alert indicator improved : warning alert mode was fixed and autosettings feature was added
Thanks but too much information. Still unable to find answers to my questions above
Ok can anyone please guide me.. I want to trade support and resistance.. either breakout or rebound..
1. Please tell me which has a better winning rate.. a breakout or a rebound (assume I will take profit till next support/resistance)
2. I have seen many successful traders taking position at the exact support/resistance (entry) with great 90% profit trades.. Dont you think it will be better if we wait for a rebound first and take entry lets say 5 pips above.. or in case of breakout 5 pips below.. Wouldnt this be better?
3. Which indicators are best for trading support and resistance (increasing probability of profits)? I look at 1hr timeframe to check support and resistance.. What should I check to confirm the currency pair has a high probability of rebound?
It would be interesting to get such statistical feedback from an algorithm.
No offense to any analysts but they kinda pull the S/R lines where it works for them (especially in seminars)
If the algo had a robust , non wavering method of calculating SR ,you'd have the perfect foundation for such
research.
Ok can anyone please guide me.. I want to trade support and resistance.. either breakout or rebound..
1. Please tell me which has a better winning rate.. a breakout or a rebound (assume I will take profit till next support/resistance)
2. I have seen many successful traders taking position at the exact support/resistance (entry) with great 90% profit trades.. Dont you think it will be better if we wait for a rebound first and take entry lets say 5 pips above.. or in case of breakout 5 pips below.. Wouldnt this be better?
3. Which indicators are best for trading support and resistance (increasing probability of profits)? I look at 1hr timeframe to check support and resistance.. What should I check to confirm the currency pair has a high probability of rebound?
Going against the trend can not give success
There no indicator which tell overbought or oversold, but with weekly chart you can see cross pairs they are more predictable
- Free trading apps
- Over 8,000 signals for copying
- Economic news for exploring financial markets
You agree to website policy and terms of use
1. Please tell me which has a better winning rate.. a breakout or a rebound (assume I will take profit till next support/resistance)
2. I have seen many successful traders taking position at the exact support/resistance (entry) with great 90% profit trades.. Dont you think it will be better if we wait for a rebound first and take entry lets say 5 pips above.. or in case of breakout 5 pips below.. Wouldnt this be better?
3. Which indicators are best for trading support and resistance (increasing probability of profits)? I look at 1hr timeframe to check support and resistance.. What should I check to confirm the currency pair has a high probability of rebound?