Trade/Range Identification
- Vsa learning club
- [ARCHIVE!] Any rookie question, so as not to clutter up the forum. Professionals, don't pass by. Can't go anywhere without you - 4.
- I have an indicator and I want to trade it
This is the example about what can be used in this case -
Forum on trading, automated trading systems and testing trading strategies
Sergey Golubev, 2013.07.01 21:04
How can we know: correction, or bullish etc (in case of using indicator for example)?
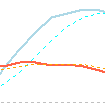
well ... let's take AbsoluteStrength indicator from MT5 CodeBase.
bullish (Bull market) :
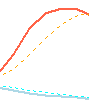
bearish (Bear market) :
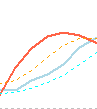
ranging (choppy market - means: buy and sell on the same time) :
flat (sideways market - means: no buy and no sell) :
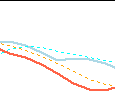
correction :
correction in a bear market (Bear Market Rally) :
Forum on trading, automated trading systems and testing trading strategies
How to Start with Metatrader 5
Sergey Golubev, 2016.08.12 17:07
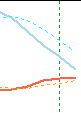
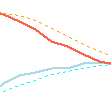
Indicator from the post above? Blue lines (signal line and the dotted line) are the bullish. The combination of those lines are providing the information about the primary trend (bullish only), and the secondary trend. Red lines (2 lines) are for bearish.
- If blue signal line is below blue dotted line = no bullish.
- If blue signal line is below blue dotted line, and red signal line is below red dotted line = flat (no bullish and no bearish).
- If 2 blue lines are above 2 red lines, and blue signal line is above blue dotted line = bullish. Opposite for bearish.
- If blue signal line is above blue dotted line, and red signal line is above red dotted line = ranging (bullish trend and bearish trend on the same time).
- If red lines are below the blue lines and we see the bearish trend on red lines = correction (secondary correction within the primary bullish trend). Opposite for the secondary rally within the primary bearish trend.
By the eway - there is big thread about it - Market Condition Evaluation based on standard indicators in Metatrader 5
---------------
Market Condition Evaluation
story/thread was started from here/different thread
================================
The beginning:
- Market condition indicators/tools thread
- MaksiGen Trading system (light Paramon): many variations of the system - the thread
- How to use Support and Resistance Effectively - educational thread
- Market condition and EAs thread
- Trend indicators thread
- Forex Market Conditions, a graphic depiction - the thread
- Evaluation of the market condition using six SMA indicators thread
- Multi-indics indicators thread
- Candle time tools thread
================================
Market condition
- the theory with examples (primary trend, secondary trend) - read staring from this post till this one
- Summary about market condition theory is on this post
- Practical examples about every market condition case by indicators: starting from this page till this one
- trendstrength_v2 indicator is here,
- AbsoluteStrength indicator new version is here
- AbsoluteStrength indicator old version is on this post
- AbsoluteStrengthMarket indicator is here to download.
- good feature in Metatrader 5: moving stop loss/take profit by mouse on the chart (video about howto)
- predictions are very different thing from technical/fundamental analytsis the post with explanation
- Technical vs. Fundamental; Short-Term vs. Medium-Term vs. Long-Term; Discretionary vs. Automated - the post
- Market condition setup (indicators and template) is here
================================
3 Stoch MaFibo trading system for M5 and M1 timeframe
- trading examples
- template to download
- explanation how to trade and more explanation here
- how to install
- 2stochm_v4 EA is on this post.
================================
PriceChannel ColorPar Ichi system.
================================
MaksiGen trading system
- indicator to download
- some explanation about the system in general how to use
- Trading examples with MT5 statement, more trading is here.
- Paramon trading system iis on this post; How to trade the system - manual trading with live examples - read this page.
================================
Merrill's patterns are on this page.
================================
Divergence - how to use, explanation and where to read about.
================================
Scalp_net trading system
- template/indicators and how to use are on this comment.
- scalp_net_v132_tf EA is on this post with optimization results/settings for EURUSD M5 timeframe
- possible settings #1 for this EA for EURUSD M5 timeframe with backtesting results is on this post.
================================
MTF systems
more to follow ...
================================
MA Channel Stochastic system is here.
================================
Ichimoku
The beginning
After
- The theory of the signals
- Ichimoku alert indicator with arrows
- Ichimoku alert indicator improved : warning alert mode was fixed and autosettings feature was added
And in case of MT4 -
============
Market Condition
The beginning:
- Market condition indicators/tools thread
- Market condition and EAs thread
- How to use Support and Resistance Effectively - educational thread
- Trend indicators thread
After
- Market Condition Evaluation (2 EAs were created) - the summary
- Market Condition Evaluation based on standard indicators in Metatrader 5 - the key thread
- Market condition - AbsoluteStrength indicator - the page
============
- Free trading apps
- Over 8,000 signals for copying
- Economic news for exploring financial markets
You agree to website policy and terms of use