Join our fan page

Murrey Math Lines (Support and Resistance) - indicator for MetaTrader 4
- Views:
- 163273
- Rating:
- Published:
- Updated:
-
 You are missing trading opportunities:
- Free trading apps
- Over 8,000 signals for copying
- Economic news for exploring financial markets
Registration Log inYou agree to website policy and terms of use
If you do not have an account, please register -
 Need a robot or indicator based on this code? Order it on Freelance
Go to Freelance
Need a robot or indicator based on this code? Order it on Freelance
Go to Freelance
Author:
The author of the MM Time Frame is xard777
The author of the MM Black is Vladislav Goshkov (VG).
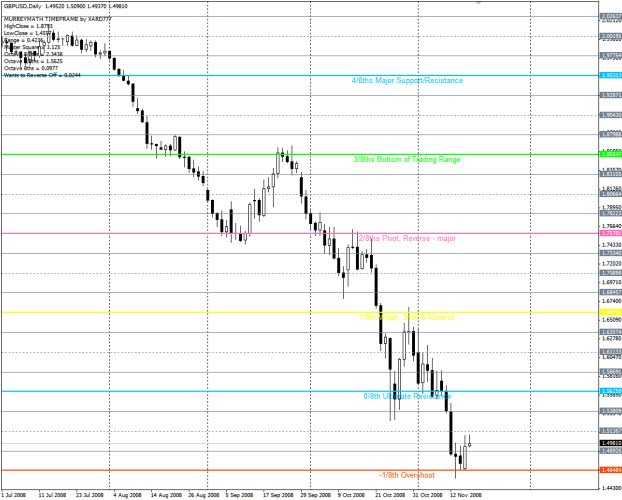
MM Lines are drawn where support and resistance is.
Characteristics of MMLs
Since, according to Gann, prices move in 1/8's, these 1/8's act as points of price support and
resistance as an entity's price changes in time. Given this 1/8 characteristic of price action,
Murrey assigns properties to each of the MML's in an a given octave. These properties are listed
here for convenience.
8/8 th's and 0/8 th's Lines (Ultimate Resistance)
These lines are the hardest to penetrate on the way up, and give the greatest support on the way
down. (Prices may never make it thru these lines).
7/8 th's Line (Weak, Stall and Reverse)
This line is weak. If prices run up too far too fast, and if they stall at this line they will reverse
down fast. If prices do not stall at this line they will move up to the 8/8 th's line.
6/8 th's and 2/8 th's Lines (Pivot, Reverse)
These two lines are second only to the 4/8 th's line in their ability to force prices to reverse. This
is true whether prices are moving up or down.
5/8 th's Line (Top of Trading Range)
The prices of all entities will spend 40% of the time moving between the 5/8 th's and 3/8 th's
lines. If prices move above the 5/8 th's line and stay above it for 10 to 12 days, the entity is said
to be selling at a premium to what one wants to pay for it and prices will tend to stay above this
line in the "premium area". If, however, prices fall below the 5/8 th's line then they will tend to
fall further looking for support at a lower level.
4/8 th's Line (Major Support/Resistance)
This line provides the greatest amount of support and resistance. This line has the greatest
support when prices are above it and the greatest resistance when prices are below it. This price
level is the best level to sell and buy against.
3/8 th's Line (Bottom of Trading Range)
If prices are below this line and moving upwards, this line is difficult to penetrate. If prices
penetrate above this line and stay above this line for 10 to 12 days then prices will stay above
this line and spend 40% of the time moving between this line and the 5/8 th's line.
1/8 th Line (Weak, Stall and Reverse)
This line is weak. If prices run down too far too fast, and if they stall at this line they will reverse
up fast. If prices do not stall at this line they will move down to the 0/8 th's line.
Recommendations:
- Use in your daily, weekly or monthly analysis before making trades.
- It is possible to use this indicator in an EA but probably should base it on some good rules and or trade method and system.
Traders Dynamic Index with Visual and Audible Alerts
I added audible alerts so that when a strong buy or strong sell signal it can generate alerts when the "SoundOn" input variable is set to true.
Lagrange's Interpolation Polynomial
The application of Lagrange's interpolation polynomial at FOREX.
Normalizer
A "cover" for the normalization of the indicator values.
 Lot_Volume
The automatic calculation of the lot size from the specified percent of free assests.