Join our fan page

CashMachine | 5 min | Hidden Stop Loss & Hidden Take Profit thresholds || EURUSD - expert for MetaTrader 4

- Views:
- 25548
- Rating:
- Published:
- Updated:
-
 You are missing trading opportunities:
- Free trading apps
- Over 8,000 signals for copying
- Economic news for exploring financial markets
Registration Log inYou agree to website policy and terms of use
If you do not have an account, please register -
 Need a robot or indicator based on this code? Order it on Freelance
Go to Freelance
Need a robot or indicator based on this code? Order it on Freelance
Go to Freelance
Author:
This is my final EA, 5 min chart is the best. I reccomend only EURUSD pair, but GBPUSD is good too. I have not checked every pair on forex market. I'm waiting for your opinion about this EA. And please try to help me write the most professional strategy based on Taichi & deMarker indicators. I invite you to my subject I set on the MQL forum: https://www.mql5.com/en/forum/109566 Let's build the most professional strategy together :))))))))))))))))))))))))))))))))))))
![]() .
.
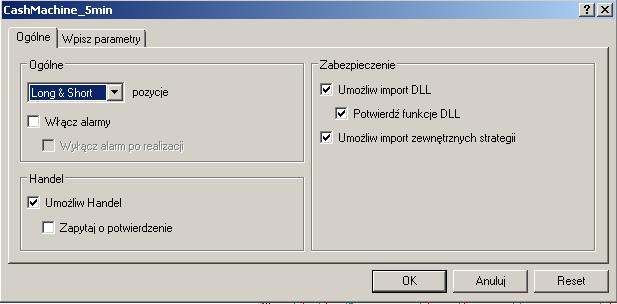
This EA based on deMarker (middle of moving averages) & Stochastic fast indicators. There are hidden stop loss and hidden take profit. The stop loss will be set on the system when min. take profit will be obtained. Try this one on real money not only demo account. Min. deposit = 3 000 PLN or 1 500 USD. I'm waiting for your opinion about this machine ... and don't forget lern more in order to help me in building the better one EA...

Recommendations:
- Max Loss 30 pips
- Max Time frame 5 MIN
- EURUSD / GBPUSD
| Symbol | EURUSD (Euro vs US Dollar) | ||||
| Okres | 5 Minut (M5) 2008.02.20 15:45 - 2008.07.03 17:45 | ||||
| Model | Every tick (the most precise method based on all available least timeframes) | ||||
| Parametry | hidden_TakeProfit=60; hidden_StopLoss=30; Lots=0.2; target_tp1=20; target_tp2=35; target_tp3=50; pidem=0; pidemu=14; pisto=0; pistok=5; pistod=3; istslow=3; | ||||
| Słupki w tescie | 27052 | Ticks modelled | 681376 | Modelling quality | 49.53% |
| Mismatched charts errors | 2 | ||||
| Depozyt początkowy | 1500.00 | ||||
| Total net profit | 1528.14 | Gross profit | 6090.11 | Gross loss | -4561.97 |
| Profit factor | 1.33 | Przewidywany zysk | 8.35 | ||
| Absolute drawdown | 523.09 | Maximal drawdown | 568.60 (15.88%) | Relative drawdown | 35.56% (539.09) |
| Transakcji w sumie | 183 | Short positions (won %) | 100 (29.00%) | Long positions (won %) | 83 (69.88%) |
| Profit trades (% of total) | 87 (47.54%) | Loss trades (% of total) | 96 (52.46%) | ||
| Największy | profit trade | 245.49 | loss trade | -78.51 | |
| Średni | profit trade | 70.00 | loss trade | -47.52 | |
| Maksimum | consecutive wins (profit in money) | 9 (704.16) | consecutive losses (loss in money) | 10 (-403.02) | |
| Maximal | consecutive profit (count of wins) | 704.16 (9) | consecutive loss (count of losses) | -403.02 (10) | |
| Średni | consecutive wins | 2 | consecutive losses | 2 | |
| # | Czas | Typ | Zlecenie | Loty | Cena | S / L | T / P | Profit | Balance: |
| 5123 | 2008.03.20 19:08 | sell | 40 | 0.20 | 1.5454 | 0.0000 | 0.0000 | ||
| 5124 | 2008.03.20 20:28 | modify | 40 | 0.20 | 1.5454 | 1.5467 | 1.5372 | ||
| 41770 | 2008.06.17 03:45 | modify | 164 | 0.20 | 1.5469 | 1.5483 | 1.5582 | ||
| 41771 | 2008.06.17 03:45 | modify | 164 | 0.20 | 1.5469 | 1.5486 | 1.5585 | ||
| 41772 | 2008.06.17 03:45 | modify | 164 | 0.20 | 1.5469 | 1.5488 | 1.5587 | ||
| 41773 | 2008.06.17 03:45 | modify | 164 | 0.20 | 1.5469 | 1.5487 | 1.5586 | ||
| 41774 | 2008.06.17 03:45 | modify | 164 | 0.20 | 1.5469 | 1.5490 | 1.5589 | ||
| 41775 | 2008.06.17 03:45 | modify | 164 | 0.20 | 1.5469 | 1.5489 | 1.5588 | ||
| 41776 | 2008.06.17 03:45 | modify | 164 | 0.20 | 1.5469 | 1.5491 | 1.5590 | ||
| 41777 | 2008.06.17 03:45 | close | 164 | 0.20 | 1.5530 | 1.5491 | 1.5590 | 122.00 | 3499.39 |
| 41778 | 2008.06.17 14:17 | buy | 165 | 0.20 | 1.5486 | 0.0000 | 0.0000 | ||
| 41779 | 2008.06.17 15:38 | modify | 165 | 0.20 | 1.5486 | 1.5500 | 1.5569 | ||
| 41780 | 2008.06.17 15:38 | modify | 165 | 0.20 | 1.5486 | 1.5499 | 1.5568 | ||
| 41781 | 2008.06.17 15:42 | s/l | 165 | 0.20 | 1.5499 | 1.5499 | 1.5568 | 26.00 | 3525.39 |
 The amplitude of price movement statistics
The amplitude of price movement statistics in a text file. Quickly and comfortably.
 TimeOut
The indicator displays the time between sending a quote by the broker and receiving it by you.
The average amplitude of the price movement for the specified period
The indicator displays the average amplitude of the price movement for the specified period.
The average amplitude of the price movement for whole history.
The indicator displays the average amplitude of the price movement.