Join our fan page

MacdPatternTraderv02 - expert for MetaTrader 4

- Views:
- 12610
- Rating:
- Published:
- Updated:
-
 You are missing trading opportunities:
- Free trading apps
- Over 8,000 signals for copying
- Economic news for exploring financial markets
Registration Log inYou agree to website policy and terms of use
If you do not have an account, please register -
 Need a robot or indicator based on this code? Order it on Freelance
Go to Freelance
Need a robot or indicator based on this code? Order it on Freelance
Go to Freelance
The original of the trade strategy is available by the following link:
http://www.unfx.ru/strategies_to_trade/strategies_134.php
The expert advisor was written to check the effectiveness of the trade strategy described by the author. You can view the educt and the description of the EA in the latest number of our journal:
http://www.fortrader.ru/ftgate.php?id=0&num=52
Short Description of the Algorithm of the EA:
1. Time period: H4;
2. Instrument: EURUSD;
Volume: 1 lot
3. Indicators: ЕMA7, EMA21, EMA359, SMA89. MACD 5,13,1.
Buy signal
1. The MACD hystogram must form the value below 0,0045;
2. After forming the maximum above 0,0045, the hystogram must reverse its movement to the direction of created maximum;
3. The stop-order is placed below the last local maximum by 10 points;
4. The first target for the 30% of positions is closed when the price's value is above the 21-period exponential average;
5. The second target for the half of positions is closed when the price reaches the value between the 89-period simple sliding average and the 365-period exponential average;
6. The third target for the residuray positions is closed when the price reaches the price resistance level.
Sell signal
Search for the sell signal
1. The MACD hystogram must form the minimum above the -0,0045 value;
2. After forming the mimimum above 0,0045, the hystogram must reverse its movement to the direction of the created minimum;
3. The stop-order is placed above the last local maximum be 10 points;
4. The first target for the 30% of positions is closed when the price's value is below the 21-period exponential average;
5. The second target for the half of positions is closed when the price
reaches the value between the 89-period simple sliding average and the
365-period exponential average;
6. The third target for the residuray positions is closed when the price reaches the price resistance level.
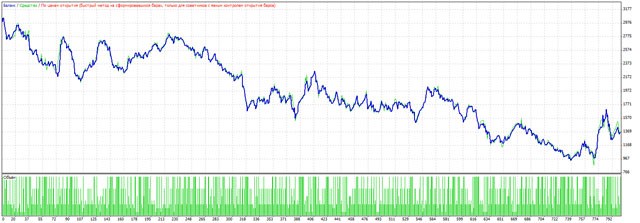
Testing of the EA with the standard parameters:
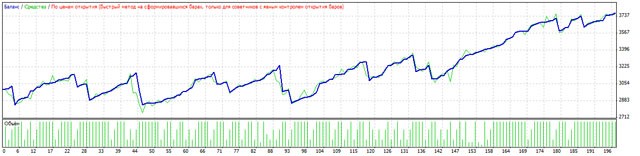
After the optimization of the parameters:
You can view the full analysis of the strategy and its testing on the future quotes in our journal:
http://www.fortrader.ru/ftgate.php?id=0&num=52
p/s all the possible variables of the strategy are outputted to the external variables, you can pick out reasonably good parameters for the intraday charts too, experiment. It is dipensable to test on the ticks. If you have any ideas for the further development or any questions about the EA, write.
Translated from Russian by MetaQuotes Ltd.
Original code: https://www.mql5.com/ru/code/8194
gpfTCPivotStop
TS on the break through of daily resistance/support levels of the Pivot indicator.
 MVV_LinearRegression
The standard linear regression channel and support/resistance levels.
Fractals.
A standard indicator Fractals, that doesn't redraw the lasr fractal....
SignalTable
An original indicator that shows buying/selling signals.