Watch how to download trading robots for free
Find us on Telegram!
Join our fan page
Join our fan page
You liked the script? Try it in the MetaTrader 5 terminal
- Views:
- 20678
- Rating:
- Published:
-
Need a robot or indicator based on this code? Order it on Freelance Go to Freelance
Author: KimIV
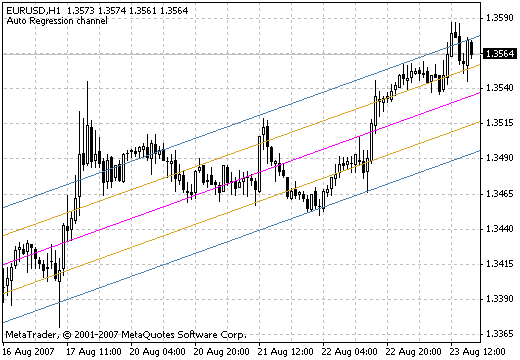
The Regression Channel is based on the Linear Regression Trend, which represents a usual trend line plotted between two points on a price chart using the method of least squares. As a result, this line proves to be the exact median line of the changing price. It can be considered as an equilibrium price line, and any deflection up or down indicates the increased activity of buyers or sellers, respectively.
Read here.

Translated from Russian by MetaQuotes Ltd.
Original code: https://www.mql5.com/ru/code/7350
 MTF_PSAR
The Parabolic SAR was also developed by Welles Wilder for use in trending markets. The author of this indicator recommended to identify the trend first, and only after that to use the PSAR for trading with the trend.
 RSTL
RSTL
Reference Slow Trend Line (RSTL) is a response of the SATL digital filter to the series of input prices with a delay equal to the Nyquist interval of 1/2F.
 RoundPrice-Ext
Very convenient to confirm any market entry signals.
 SATL
SATL
(Slow Adaptive Trend Line) – the «slow» adaptive trend line is calculated using a digital low-pass filter LPF-2. LPF-2 serves to eliminate the noises and market cycles with longer fluctuation periods.