Join our fan page

MT4Orders QuickReport - library for MetaTrader 5

Optimizing trading strategies in Meta Trader 5 (MT5)? Use an advanced and more visual representation of optimization results with the benefits of interactive HTML pages.
Briefly about the benefits:
- Filters by any criterion and threshold (min/max).
- Views:
- 2859
- Rating:
- Published:
-
 You are missing trading opportunities:
- Free trading apps
- Over 8,000 signals for copying
- Economic news for exploring financial markets
Registration Log inYou agree to website policy and terms of use
If you do not have an account, please register -
 Need a robot or indicator based on this code? Order it on Freelance
Go to Freelance
Need a robot or indicator based on this code? Order it on Freelance
Go to Freelance
Fast JavaScript version of Report library for MT4 style trading commands implemented via MT4Orders or Virtual.
Works up to 10 times faster than Report, NTML file size is smaller, can upload and display up to 5.4 million report lines (screenshot below).
Functionality: (the same as Report)
- Shows trades executed by MT4, MT5, their testers or Virtual tester.
- Shows charts
- Opens HTML file with report in a browser (requires permission to use DLL and #define REPORT_BROWSER command).
Differences from Report:
- In MT5 side code, all data for the report is immediately output to the file as an array, without assembling lines with HTML code. This results in a great speed increase and reduction of file size.
- Calculation of statistics, charting and generation of HTML code with lines of deals is done on the browser side in JavaScript code. A paginator is made, which shows the necessary page.
- Charts display deals on a time scale rather than on a uniform scale by deal number. Thus, we can see that an Expert Advisor made 1000 deals in week 1 and was inactive for another 52 weeks.
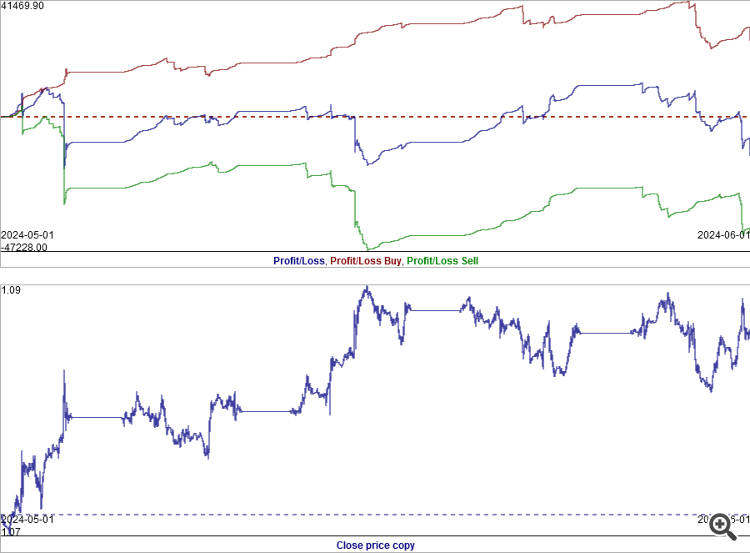
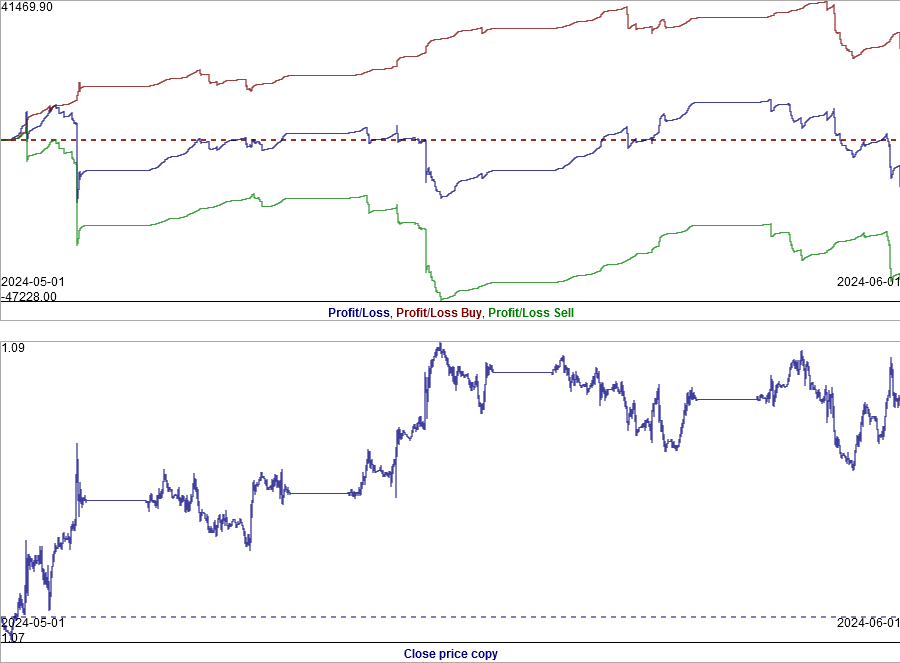
Here is an illustrative example with 3386 deals for 5 years:

The same deals are placed on both charts.
The upper chart is built with a uniform step between deals (as the MetaQuotes tester shows now). It looks promising.
The lower chart is built on a time scale and shows that the Expert Advisor has traded only a few weeks in 5 years. 1 pixel horizontally = 1 week.
According to the lower chart, it is immediately clear that there will be 2 years of inactivity in the beginning, then the Expert Advisor will trade for a few weeks and then 2.5 years of inactivity again. Such trading is not as interesting as the impression from the first chart. - The balance chart with options without slippage, without commission, without commission and slippage has been replaced by the profit (P/L) chart with the same options (without balance operations).
- Added a separate balance chart, which will show balance operations deposits/withdrawals. This way you can see separately the work of trade operations on the P/L chart and their amounts with balance operations
- If you click on any chart, an interactive Google.charts will open. In it you can zoom in and see the trades in detail. 4 P/L charts with 100,000 trades open for ~10 seconds.
-
The TurnOver chart is replaced by a chart with P/L for buys, sells and their amount. This way you can understand whether your strategy is bullish or bearish. You may decide to switch off one of the trading directions if it is not profitable. The chart of instrument closing price is shown below it. It is convenient to track how purchases make profit when the rate rises and sales make loss, and vice versa when the rate falls. If there are several instruments, their prices will be shown together, it is better to select only one of the instruments by filter to see only its price.
-
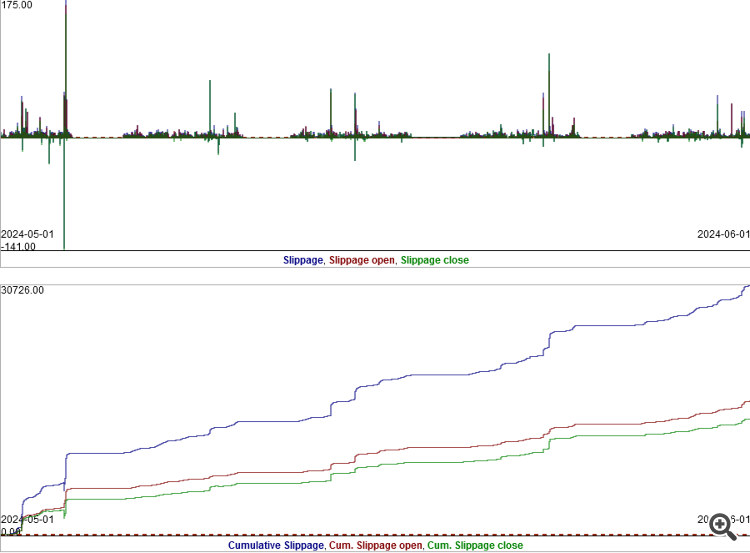
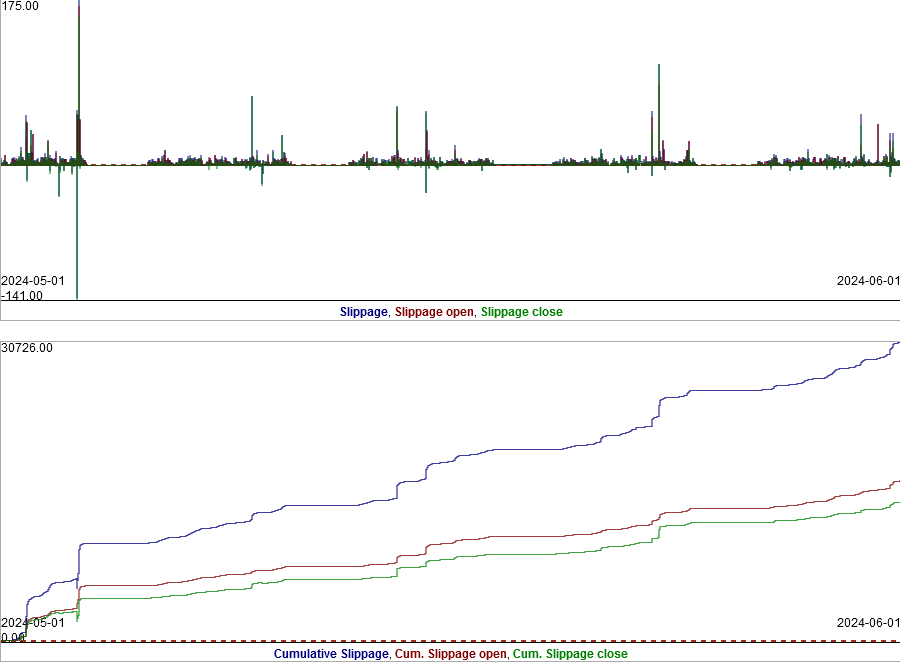
Added charts of slippages and cumulative slippages at opening, closing and their sum, the idea was taken from here https://www.mql5.com/ru/blogs/post/760817.
- A little rearranged the columns of the report, but there is a checkbox that will rearrange them as in Report-e. If you are more used to it.
- When working in Virtual, you can make several calls to QuickReport and generate reports for each virtual (if there are several) and/or real MT5 tester
Examples of use:
- simple with MT4Orders
#include <MT4Orders.mqh>
#define REPORT_BROWSER            // Open report in browswer automatically. Require DLL.
//#include <Report.mqh>
#include <MT4Orders_QuickReport.mqh>//

void OnInit(){}

void OnTick(){ strategy (); }

void OnDeinit(const int  reason ){
   QuickReport("report", true);
}

int TimeHour     ( datetime time ){return((int)((time / 3600) % 24));}//current hour in day. 3600 sec in hour

void strategy (){
  string Symb = _Symbol;
  MqlTick Tick;
  if (SymbolInfoTick(Symb, Tick)){
    if(TimeHour(TimeCurrent())<23 && TimeHour(TimeCurrent())>0 ){return;}
    OrderSend(Symb, OP_BUY,  10, Tick.ask, 0, Tick.bid, Tick.bid,  NULL, 1000);
    OrderSend(Symb, OP_SELL, 10, Tick.bid, 0, Tick.ask, Tick.ask,  NULL, 1000);
   }
}
- large test code
- simple with Virtual
#include <MT4Orders.mqh>

#include <fxsaber\Virtual\Virtual.mqh>
#define REPORT_BROWSER            // Open report in browswer automatically. Require DLL.
//#include <Report.mqh>
#include <MT4Orders_QuickReport.mqh>

double OnTester() { //or OnDeinit()
   for (int v = 0 ; v <= VIRTUAL::Total(); v++){if (VIRTUAL::SelectByIndex(v)){QuickReport("report_"+(string)v, true, v);}} //show report for each tester
   return(AccountInfoDouble(ACCOUNT_BALANCE));
}
- description of call parameters
void QuickReport(string file_name, bool is_open_file_in_browser=true, int virtual_number=0, bool hide_account_and_name=false, bool common_path=false, bool fileANSI=true){...}
file_name - file name for recording
is_open_file_in_browser - automatically open the file in the browser when the calculation is completed (DLL permission is required). Files will not be automatically opened during optimisation, as there can be several thousands of them.
virtual_number - (to work with Virtual) number of virtual tester (-1 - will be determined automatically, 0 - MT5 tester, >0 - virtual testers)
hide_account_and_name - hide account number and name
common_path - save to the common folder of terminals. To prevent the files from being overwritten by another agent during optimisation, the agent number (3000, 3001,...) is added to the file names. When saving in the tester folder (false), they are saved in the folder of the agent that performed the calculations.
fileANSI - save in ANSI encoding or in UNICODE. The size of UNICODE files is 2 times larger and they take longer to process, so if you upload a lot of data, for example 1 GB, it is more economical to use ANSI. UNICODE is added for compatibility with third-party services if you need it.
Example report for 5.4 million transactions:
( Virtual with report more than 100 000 lines on my computer eats all memory and hangs, for this reason I made JavaScript version).

This report showed Firefox. Chrome hangs, it needs smaller files.
More than 5.4 million rows can be uploaded to a file, but the Firefox browser can't handle any more.
When loading this report, the browser used about 6GB of memory (processed about 1 minute), then freed it, after which the report is displayed on the page: (Report uses 5-6GB from 80-100 thousand lines).

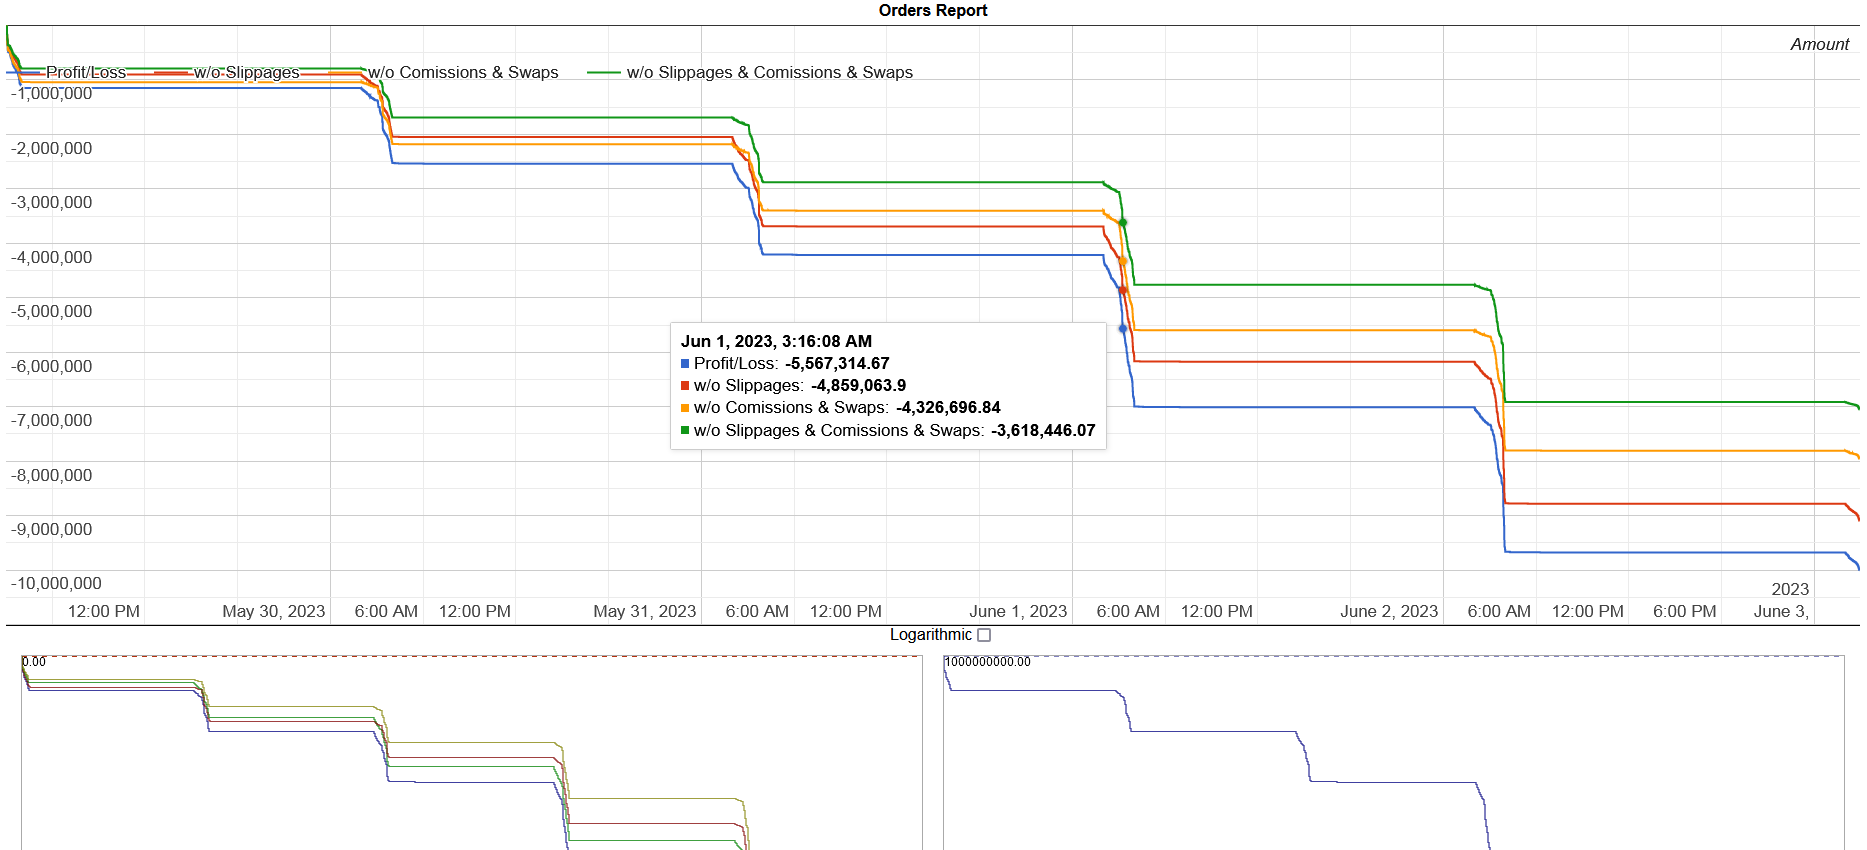
Detailed chart with zooming.
Clicking on any chart will open an interactive chart with that chart, with the ability to zoom in for detailed viewing.
There are 2 options:
- The default is the free Google.charts
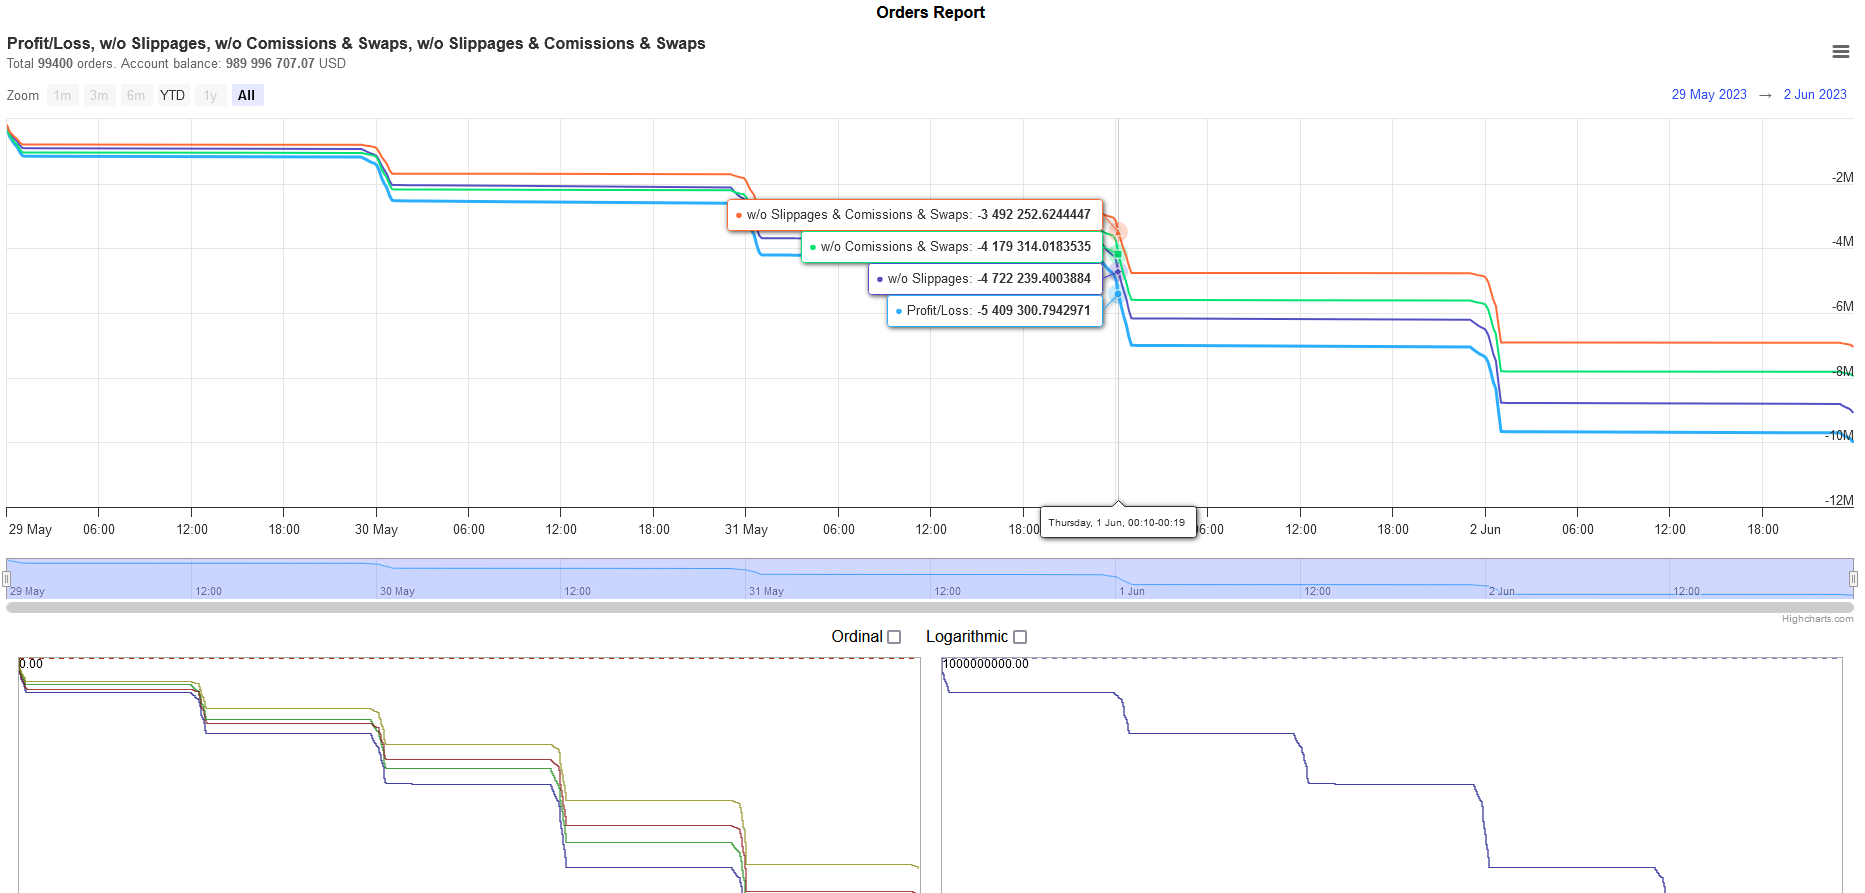
- You can connect Highcharts, which as a commercial product is faster and more convenient, but it can only be used for free by programmers during development; when releasing a project/product, a licence must be purchased and renewed annually. Read more here https://shop.highcharts.com/
You can select Logarithmic - logarithmic scale (may be useful if you have exponential balance growth). For Highcharts you can additionally select Ordinal - uniform step (as in MetaQuotes tester reports). After changing these items, you need to click again on the desired chart to apply the selected option.
Example from Google.chart: (zooming with the mouse wheel).
Example from Highcharts: (change the scale by selecting the necessary area with the mouse).
Executed MT5 pending orders
For orders that appeared as a result of pending orders triggering, the Type field shows in dark blue colour the type of pending order (Buy limit, Sell limit, Buy stop or Sell stop), the time from setting to triggering of the order in seconds and the type of activated order/position. This information is shown only for MT5 terminal or tester, virtual testers or MT4 do not provide this information.

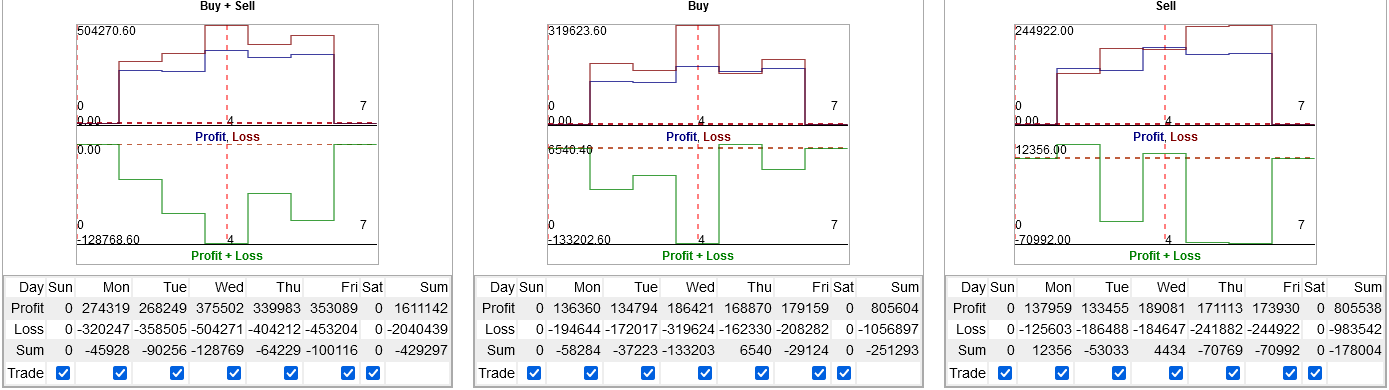
Profit and loss graphs by hour and day of the week.
Unlike the MQ tester, profits and losses are displayed not at the moment of their occurrence, but by the time of entering a trade. This makes it easier to understand that entries in a certain hour are mostly unprofitable and simply switch off this hour for entries.
Additionally, charts on purchases and sales have been made.
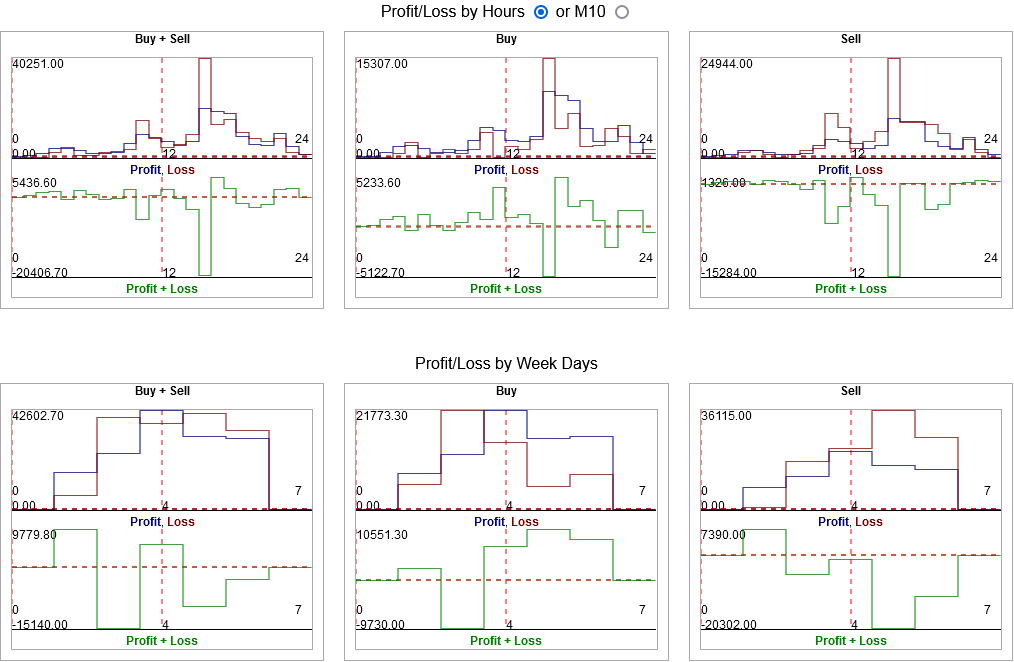
If you click on any of these charts, you will see tables with exact amounts by hours and days. There are also checkboxes that can be used to disable hours and days from the inputs - the charts and tables will be rebuilt and you will be able to evaluate the result without additional tests. It is an analogue of BestInterval from Fxsaber, but more coarse (with a step of 1 hour) and without automation. M10 interval was added to reduce the step.
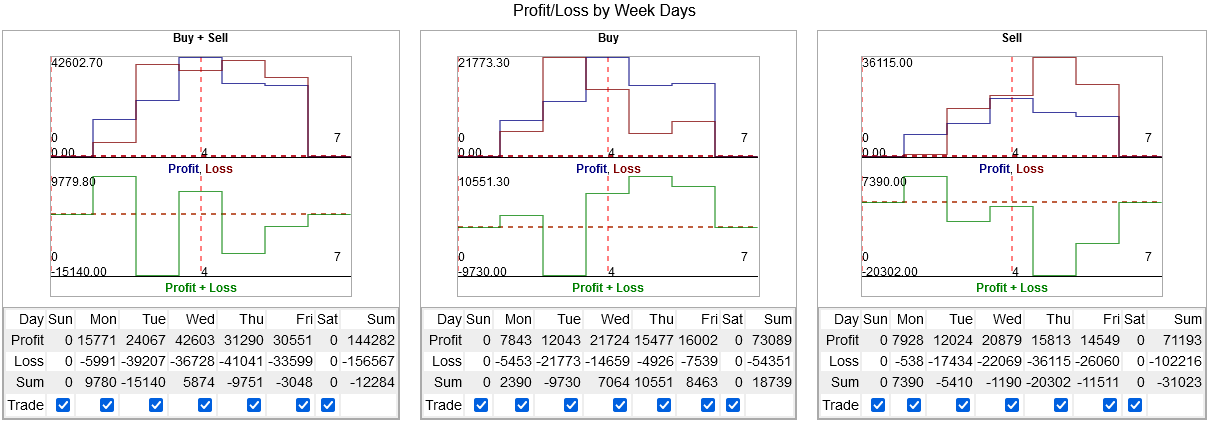
Some hourly or daily bursts of profit on these charts can be seen on small test periods. The charts above show a 1 month test with an upward trend. So buying is in profit and selling is in loss. If you increase the test to a year or more, when several large trends in both directions will pass, everything will become evenly smeared and usually unprofitable, so it is unlikely that you will be able to switch something off and get a significant change in profit.
Here is what became on the same strategy with the test for 1 year: (you should switch off almost everything).
So it can hardly become the basis of your strategy.
Order filtering.
Many filters have been added to display orders by different parameters.
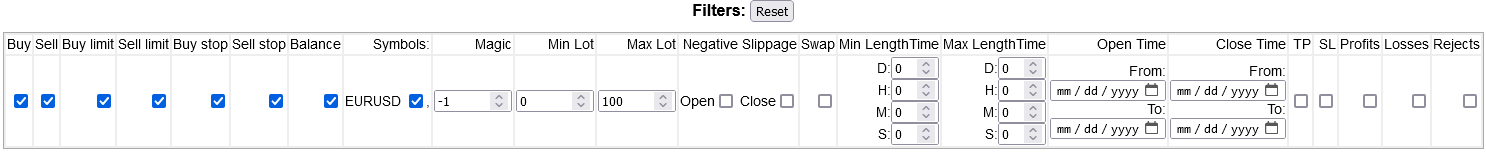
Buy, Sell, Buy limit, Sell limit, Buy stop, Sell stop, Balance - you can remove any type of orders from the report.
Symbols - will show the whole list of used instruments, you can select only the necessary ones.
Magic - you can show orders only with specified Magic
Min Lot, Max Lot - you can select orders with required lots
Negative Slippage - you can show orders with negative slippage separately for opening orders or for closing
Swap - shows orders with swaps > 0
Min LengthTime - orders with duration more than specified time (specified by number of days, hours, minutes and seconds)
Max LengthTime - orders with duration less than specified time
Open Time - time of order opening from and to specified dates
Close Time - time of order closing from and to specified dates
TP, SL - orders that ended with TP or SL triggering
Profits, Losses - orders in profit or loss (commissions and swaps are not included, they can make the final profit negative)
Rejects - unexecuted orders.
The Reset button allows you to reset filters to default values and show all orders without filtering.
Additional options:
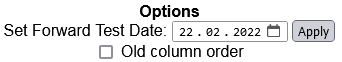
- You can specify the start date of the forward test, after it is applied the statistics of the full plot, the plot before the specified date (BackTest) and the plot after it (ForwardTest) will be calculated. The graphs will show a vertical line on this date.
- Old column order - column order will be rearranged as in the Report library
P.S. The more comments on trades, the smaller number of rows can be displayed. A report with 5.4 million rows had no comments except "end of test". So it's better not to put them if the report will be more than 4 million transactions.
P.P.S. Works in both MT5 and MT4. Thanks to fxsaber for modification for MT4.
Improvement options:
- You can try to unload the report into a binary file and read it in the browser, maybe it can work with a large 5.4 million number of rows. But then we will have to manually select the binary file due to security restrictions. That is, we will not be able to automatically open the report immediately after the test.
Translated from Russian by MetaQuotes Ltd.
Original code: https://www.mql5.com/ru/code/47816
 iCHO Trend CCIDualOnMA Filter
Strategy based on the standard indicator iCHO (Chaikin Oscillator, CHO) and custom indicator 'CCIDualOnMA'
Manual Position Tracking Panel
Panel based on CDialog class. Work on the current symbol. Deleting, setting Take Profit, setting Breakeven on a group of positions
 Angle and Speed
The indicator shows the angle or average speed of price change.
Uniformity Factor Indicator
This is a simple analytical (non-signal, one-time calculated) indicator that allows you to test the hypothesis that price timeseries represent a "random walk", specifically Gaussian "random walk". This can help to construct a parametric transformation of price increments into evenly distributed, more stable and predictable time series, at least in terms of volatility.