Join our fan page
- Views:
- 4274
- Rating:
- Published:
-
Need a robot or indicator based on this code? Order it on Freelance Go to Freelance
Inspired by the message

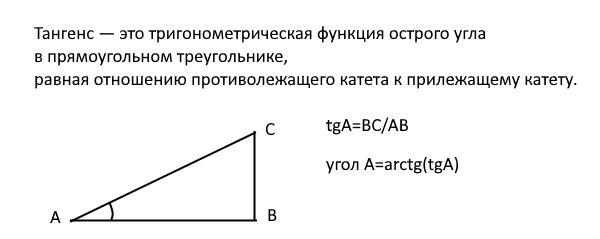
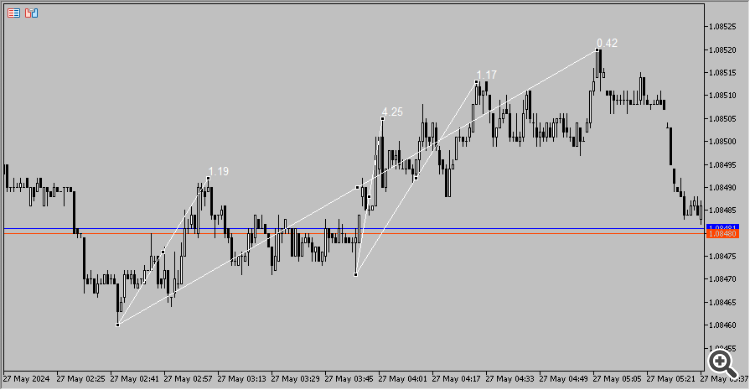
The indicator calculates the angle between the trend line and the horizontal. On the X axis - minute bars are taken, regardless of the timeframe, on the Y axis - points.
Please note that local minima or maxima on the lower timeframes may not coincide with the beginning of the bar on the higher TFs.
Because of this, the indicator values may not differ significantly on different TFs.
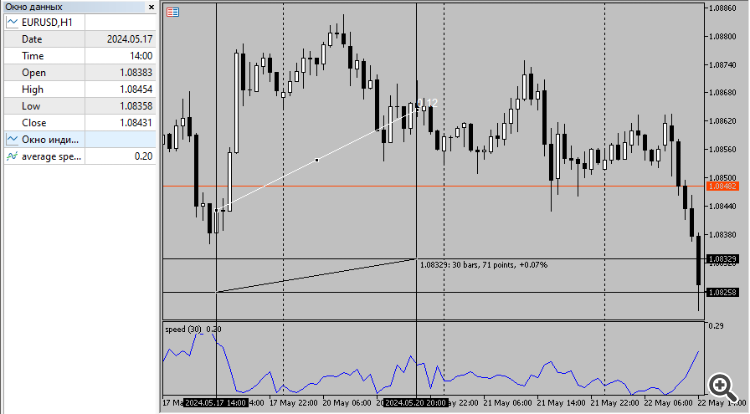
The second variant of the indicator calculates the average rate of price change - pips/minute.
How to use this indicator? I don't know. Imho, absolutely useless thing.
I added a basement. However, the same useless.
Translated from Russian by MetaQuotes Ltd.
Original code: https://www.mql5.com/ru/code/49985
 MT4Orders QuickReport
Fast JavaScript version of Report library from fxsaber for MT4-style trading commands implemented via MT4Orders or Virtual. Works up to 10 times faster, NTML file size is smaller, can upload and display up to 5.4 million report lines.
 iCHO Trend CCIDualOnMA Filter
Strategy based on the standard indicator iCHO (Chaikin Oscillator, CHO) and custom indicator 'CCIDualOnMA'
 Uniformity Factor Indicator
This is a simple analytical (non-signal, one-time calculated) indicator that allows you to test the hypothesis that price timeseries represent a "random walk", specifically Gaussian "random walk". This can help to construct a parametric transformation of price increments into evenly distributed, more stable and predictable time series, at least in terms of volatility.
 Second Bars
The indicator draws an arbitrary second timeframe on the chart.


