Watch how to download trading robots for free
Find us on Twitter!
Join our fan page
Join our fan page
You liked the script? Try it in the MetaTrader 5 terminal

MTF_RSI - indicator for MetaTrader 5
- Views:
- 7313
- Rating:
- Published:
-
 You are missing trading opportunities:
- Free trading apps
- Over 8,000 signals for copying
- Economic news for exploring financial markets
Registration Log inYou agree to website policy and terms of use
If you do not have an account, please register -
 Need a robot or indicator based on this code? Order it on Freelance
Go to Freelance
Need a robot or indicator based on this code? Order it on Freelance
Go to Freelance
The "Multi timeframes RSI" oscillator shows data of three RSI indicators from different timeframes on the current one.
It has seven input parameters:
- RSI period - RSI calculation period
- Overbought - overbought level
- Oversold - oversold level
- Drawing mode - indicator drawing type
- Steps - as a ladder
- Slope - sloping lines
- First RSI timeframe - the timeframe of the first RSI
- Second RSI timeframe - the timeframe of the second RSI
- Third RSI timeframe - the timeframe of the third RSI
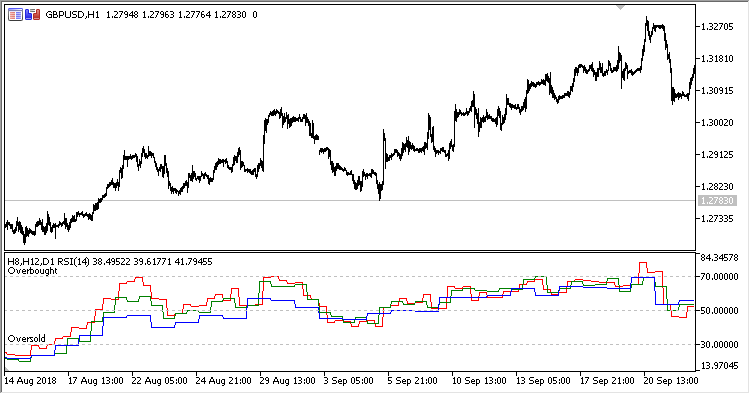
Fig.1. Multi timeframes RSI, H8, H12 and D1 data on the H1 chart, Drawing mode = Steps
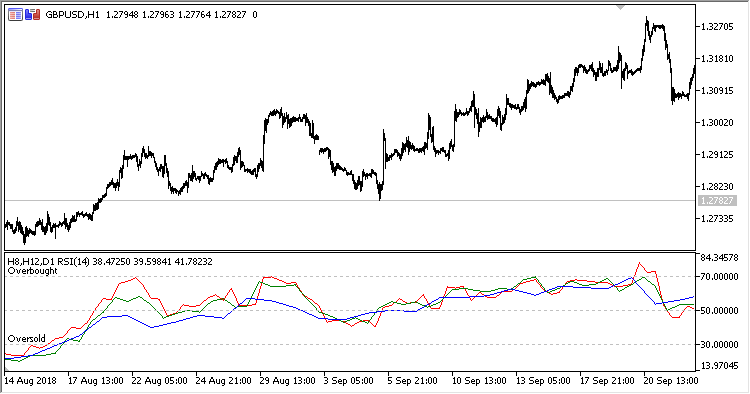
Fig.2. Multi timeframes RSI, H8, H12 and D1 data on the H1 chart, Drawing mode = Slope
Translated from Russian by MetaQuotes Ltd.
Original code: https://www.mql5.com/ru/code/23327
 MACD Cleaner
An Expert Advisor based on the iMACD indicator (Moving Average Convergence/Divergence, MACD)
 SetColorFiboLevels
The script creates the Fibonacci levels graphic object with a large number of settings.