Join our fan page

MFI_normalized - indicator for MetaTrader 5
- Views:
- 7937
- Rating:
- Published:
-
 You are missing trading opportunities:
- Free trading apps
- Over 8,000 signals for copying
- Economic news for exploring financial markets
Registration Log inYou agree to website policy and terms of use
If you do not have an account, please register -
 Need a robot or indicator based on this code? Order it on Freelance
Go to Freelance
Need a robot or indicator based on this code? Order it on Freelance
Go to Freelance
Bollinger Bands are used for calculating overbought/oversold zones.
There are four input parameters:
- MFI period - MFI calculation period
- MFI applied volume - volume used for MFI calculation
- BB period - Bollinger Bands calculation period
- BB deviation - Bollinger Bands deviation
Calculation:
NormMFI = (MFI-BL) / (TL-BL)
where:
TL = BBands(MFI, BB period, BB deviation, UPPER_BAND)
BL = BBands(MFI, BB period, BB deviation, LOWER_BAND)
MFI - Money Flow Index(MFI period, MFI applied volume)
BBands - UPPER_BAND and LOWER_BAND of Bollinger Bands
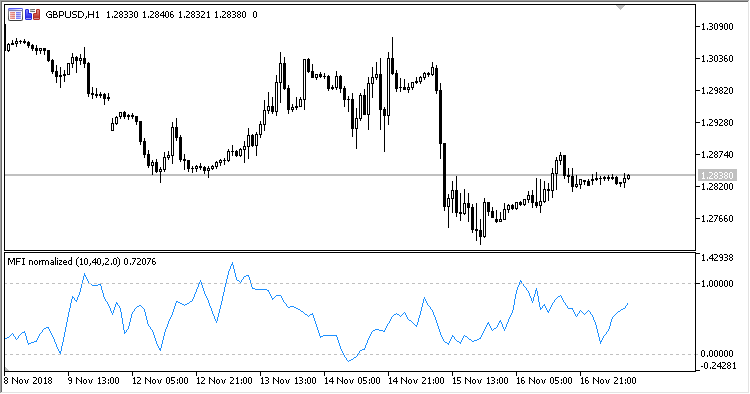
Fig.1. MFI normalized
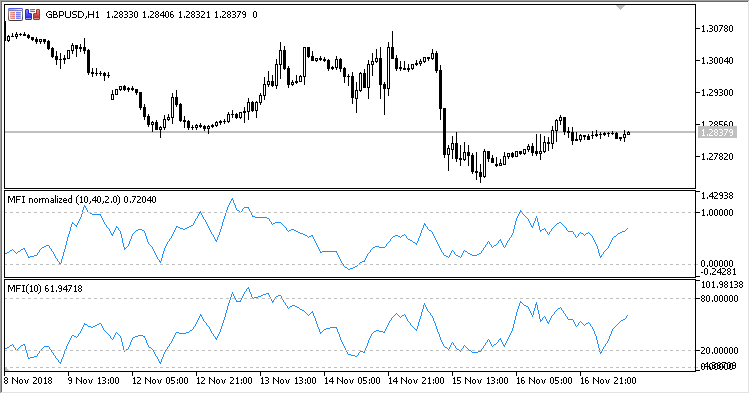
Fig.2. MFI normalized + MFI
Translated from Russian by MetaQuotes Ltd.
Original code: https://www.mql5.com/ru/code/23285
ColorMFI_X20_Cloud
The ColorMFI_X20 indicator featuring background filling in overbought/oversold areas
ColorMFI_X20
Twenty MFI indicators displayed in one window. Each line can be colored depending on its position relative to overbought and oversold areas
CandlesAutoFibo
The indicator builds Fibonacci levels at candlesticks High and Low, based on the timeframe specified in the indicator parameters
XFisher_org_v1_Vol_Supr_Zer_HTF
The XFisher_org_v1_Vol_Supr_Zer indicator with the possibility to change the indicator timeframe using input parameters