Watch how to download trading robots for free
Find us on Telegram!
Join our fan page
Join our fan page
You liked the script? Try it in the MetaTrader 5 terminal
- Views:
- 4444
- Rating:
- Published:
-
Need a robot or indicator based on this code? Order it on Freelance Go to Freelance
Original author:
Ivan Kornilov
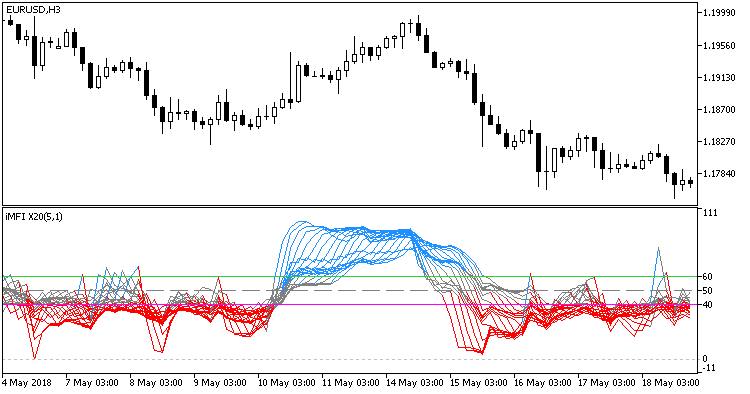
Twenty MFI indicators displayed in one window. Each line can be colored depending on its position relative to overbought and oversold areas. When launching the indicator, you can change the style and color of only the first indicator line, while the remaining lines will have a similar look.
//+-----------------------------------+
//| Indicator input parameters        |
//+-----------------------------------+
input uint StartMFIPeriod=5;                       // initial period
input uint  step = 1;                              // period step
input ENUM_APPLIED_VOLUME VolumeType=VOLUME_TICK;  // volume
input uint                 HighLevel=60;           // overbought level
input uint                 MidLevel=50;            // middle level
input uint                 LowLevel=40;            // oversold level

Fig.1. The ColorMFI_X20 indicator
Translated from Russian by MetaQuotes Ltd.
Original code: https://www.mql5.com/ru/code/23280
 Exp_SpearmanRankCorrelation_Histogram
The trading system based on SpearmanRankCorrelation_Histogram indicator signals
 VTS_Float_Pivot_Smoothed_HTF
The VTS_Float_Pivot_Smoothed indicator with the ability to change the indicator timeframe using input parameters
 ColorMFI_X20_Cloud
The ColorMFI_X20 indicator featuring background filling in overbought/oversold areas
 MFI_normalized
The MFI normalized indicator