Join our fan page
- Views:
- 8170
- Rating:
- Published:
-
Need a robot or indicator based on this code? Order it on Freelance Go to Freelance
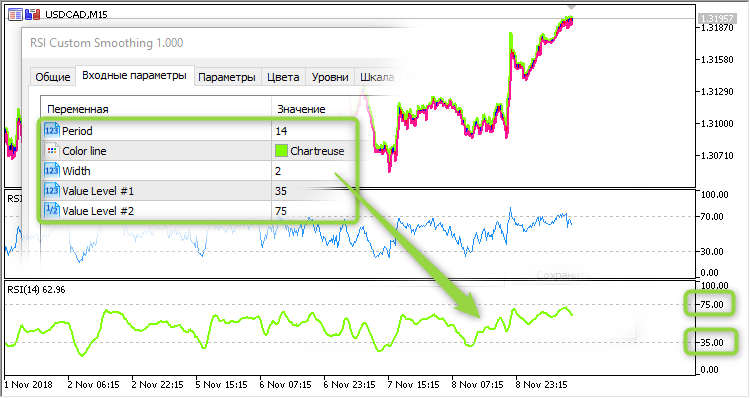
The following settings are now available as input parameters:
- color of the indicator main line
- width of the indicator main line
- values of the two indicator levels

What is the purpose of the above updates: now, indicator levels and colors can be managed from within the Expert Advisor. This feature is especially useful during visual testing. For example, non-standard levels are set in the EA: 35 and 75. When using the RSI Custom Smoothing in the visual testing mode, the levels of 35 and 75 will be displayed on the chart.
Indicator buffer smoothing has been added. Smoothing is performed though a Simple averaging method with the period of 6.
An example of creating an indicator handle in the EA:
//--- create handle of the indicator iRSI
   handle_iCustom=iCustom(m_symbol.Name(),Period(),"RSI Custom Smoothing",Inp_RSI_Period,
                          Inp_RSI_Color,Inp_RSI_Width,Inp_RSI_Level1,Inp_RSI_Level2);
//--- if the handle is not created
   if(handle_iCustom==INVALID_HANDLE)
     {
      //--- tell about the failure and output the error code
      PrintFormat("Failed to create handle of the iRSI indicator for the symbol %s/%s, error code %d",
                  m_symbol.Name(),
                  EnumToString(Period()),
                  GetLastError());
      //--- the indicator is stopped early
      return(INIT_FAILED);
     }
Translated from Russian by MetaQuotes Ltd.
Original code: https://www.mql5.com/ru/code/23156
 Yesterday Today
Trading is based on the analysis of yesterday's OHLC with the current day value.
 RSI EA v2
RSI EA - trading based on overbought/oversold zones determined by the iRSI (Relative Strength Index, RSI) indicator.
 X2MA_2HTF
Two X2MA moving averages from different timeframes, drawn in a single window as a color cloud colored according to the trend direction
 Super_Signals_Channel
A redrawing channel, which looks into the future by a certain amount of bars specified in the appropriate input parameter