Watch how to download trading robots for free
Find us on Twitter!
Join our fan page
Join our fan page
You liked the script? Try it in the MetaTrader 5 terminal

OHLC_Volume_Histo - indicator for MetaTrader 5
- Views:
- 9153
- Rating:
- Published:
-
 You are missing trading opportunities:
- Free trading apps
- Over 8,000 signals for copying
- Economic news for exploring financial markets
Registration Log inYou agree to website policy and terms of use
If you do not have an account, please register -
 Need a robot or indicator based on this code? Order it on Freelance
Go to Freelance
Need a robot or indicator based on this code? Order it on Freelance
Go to Freelance
OHLC Volume Histogram displays the difference between two streams of the OHLC Volume volume indicator as a colored histogram.
There are no input parameters.
Calculation:
Histogram = StreamUP - StreamDN
where:
StreamUP = Volume * UP_Coeff / (UP_Coeff+DN_Coeff)
StreamDN = Volume * DN_Coeff / (UP_Coeff+DN_Coeff)
UP_Coeff = High-Open
DN_Coeff = Close-Low
Volume - tick volume
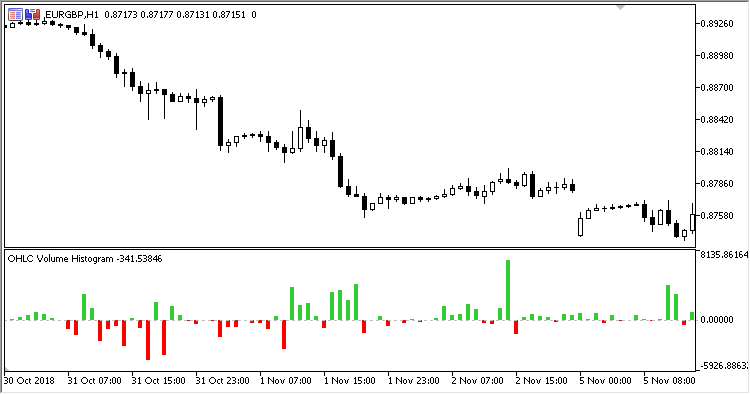
Fig.1. OHLC Volume Histogram
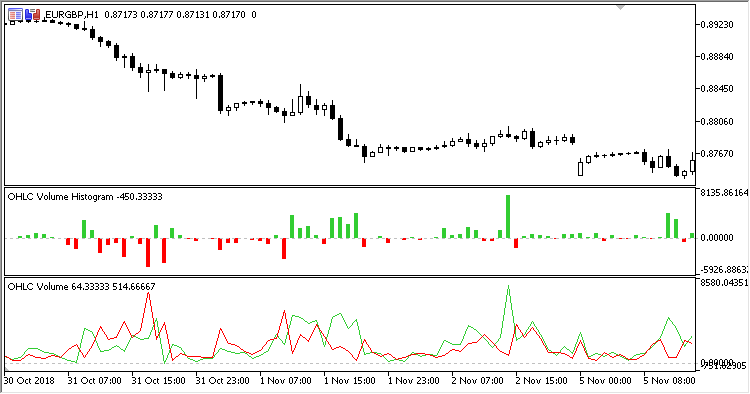
Fig. 2. OHLC Volume Histogram + OHLC Volume
Translated from Russian by MetaQuotes Ltd.
Original code: https://www.mql5.com/ru/code/23111
ROC_with_Signal_MA
The ROC indicator with signal Moving Average
Ultimate_Oscillator
The Ultimate Oscillator indicator