Join our fan page
- Views:
- 4625
- Rating:
- Published:
- Updated:
-
Need a robot or indicator based on this code? Order it on Freelance Go to Freelance
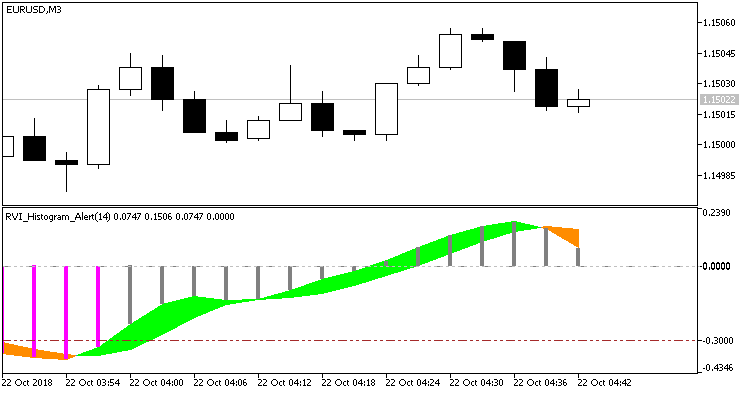
Indicator RVI_Histogram provides alerts and sends email and push notifications when the main and signal lines intersect, accompanied by a change in the color of the signal cloud.
//+-----------------------------------+
//|   INDICATOR INPUT PARAMETERS      |
//+-----------------------------------+
input uint RVIPeriod=14;                       // indicator period
input double HighLevel=+0.3;                   // overbought level
input double LowLevel=-0.3;                    // oversold level
input int Shift=0;                             // Horizontal shift of the indicator in bars
input uint NumberofBar=1;       // Bar number to activate a signal
input bool SoundON=true;        // Enable an alert
input uint NumberofAlerts=2;    // Number of alerts
input bool EMailON=false;       // Enable mailing the signal
input bool PushON=false;        // Enable sending the signal to mobile devices

Fig1. Indicator RVI_Histogram_Alert. Intersection of the main and signal lines

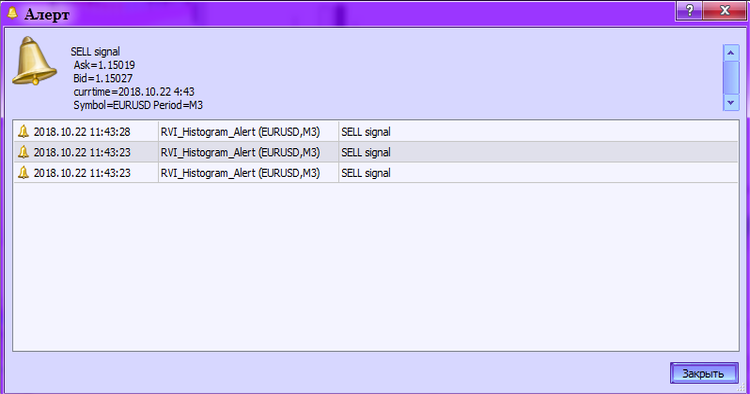
Fig. 2. RVI_Histogram_Alert. Activating an alert.
Translated from Russian by MetaQuotes Ltd.
Original code: https://www.mql5.com/ru/code/22863
 Stochastic_Histogram_Alert
Indicator Stochastic_Histogram provides alerts and sends email and push notifications when the main and signal lines intersect, accompanied by a change in the color of the signal cloud
 XFisher_org_v1_Alert
Indicator XFisher_org_v1 provides alerts and sends email and push notifications when the main and signal lines intersect, accompanied by a change in the color of the signal cloud
 MA MACD Position averaging v2
An Expert Advisor based on iMA (Moving Average, MA) and iMACD (Moving Average Convergence/Divergence, MACD). Averaging positions, in case of a loss. Improvement of the version 1.0
 XFisher_org_v2_Candle
Indicator XFisher_org_v2_Candle highlights the candles, the Close prices of which are closed within overbought/oversold zones