Join our fan page

Stochastic volatility - on chart - indicator for MetaTrader 5

- Views:
- 10976
- Rating:
- Published:
- Updated:
-
 You are missing trading opportunities:
- Free trading apps
- Over 8,000 signals for copying
- Economic news for exploring financial markets
Registration Log inYou agree to website policy and terms of use
If you do not have an account, please register -
 Need a robot or indicator based on this code? Order it on Freelance
Go to Freelance
Need a robot or indicator based on this code? Order it on Freelance
Go to Freelance
The theory:
The indicator is made after the original work and idea of Francesco G. Cavasino (described in his published article "Stochastic volatility").
- Original stochastic (OriginalStoch input variable in the code or Calculate using original stochastic option in the inputs tab of the indicator) - do you want the indicator to calculate the smoothness of the stochastic the original George Lane way or do you want it to be calculated as an EM. By default it is set to true.
- Original volatility (OriginalVolatility input variable in the code or Calculate using original volatility option in the inputs tab of the indicator) - in the original indicator historical volatility was predicted to be calculated on daily data and the assumption was that there are 252 working days in a year. If you are using the indicator on a time frame that is not daily, it is probably smarter to turn the original volatility calculation off (setting this parameter to false).
Some explanation of usage:
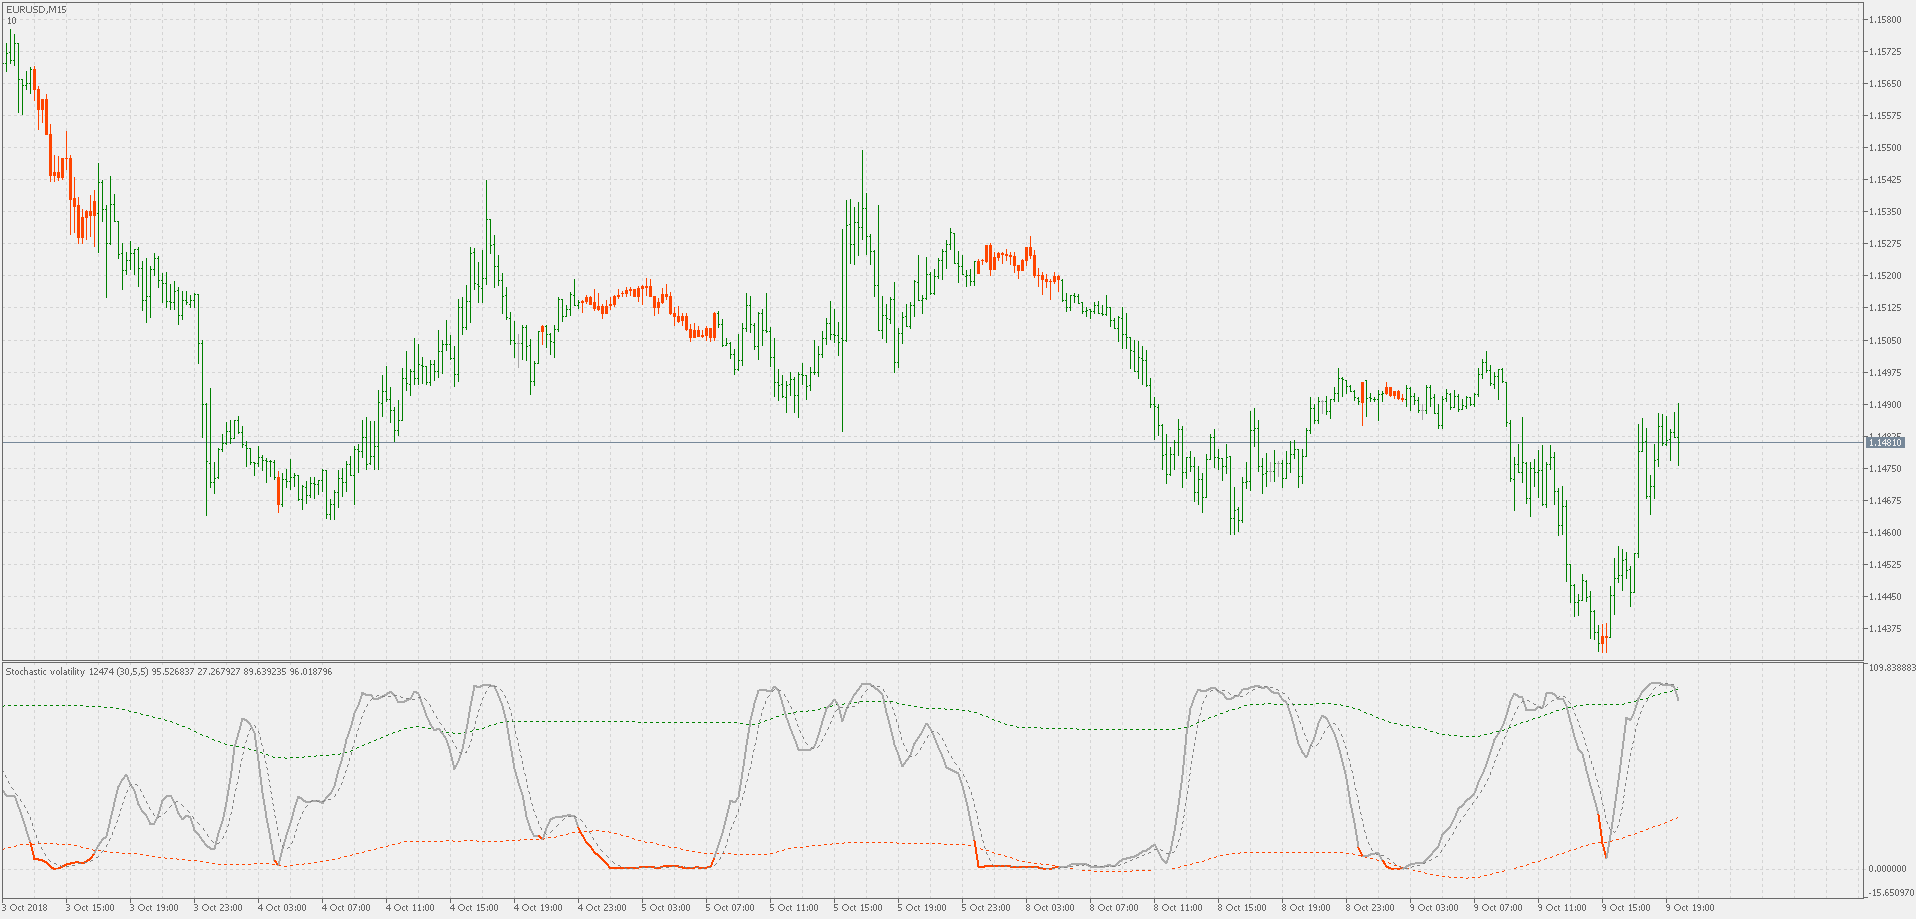
This is not a directional indicator. This means that even it is stochastic it does not show the direction of the market, but shows the direction-amount-size of volatility. The assumption that seems sound enough and after which this indicator is made is that in the times of extremely low volatility it is a good time to enter the market, since the change in volatility is imminent. Those times are marked by red lines in the indicator sub-window and by red candles on chart. For direction of entry, you should use some other trend showing indicator(s).
This version:
One version was already posted (a "regular" sub-window version, it was published here: Stochastic volatility) but this one is not using that indicator for work. The reason why it is not, is that some operations (like calculation long period simple moving average and standard deviation on a modified data that is not standard data is very, but very slow if coded as pure MQL). Hence this indicator is broken into functional parts that are each doing the job using whenever built in indicators are possible to use, and which, when combined, are doing the complete job.
Attached are all the mq5 files, but for the sake of simplicity (since some are going to have issues to compile this) all the ex5 files (in the attached zip file) are going to be attached in a separate post following this post so that one does not need to know all the steps how to make a multi file compilation that expects certain steps to be followed in exact order.
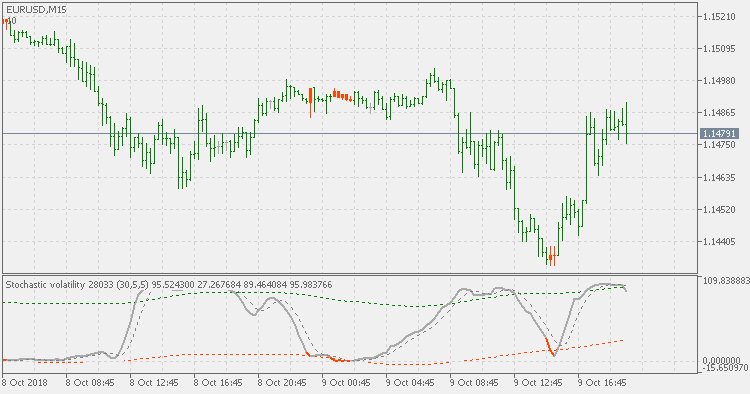
Each and every attached indicator can work on its ow, but the two "final" indicators are the "on-chart" and the "2" indicators. The "base" indicators are, what their name tells, used for base calculations. Here is the look of the "on-chart" version (it automatically loads the "2" too in order to display it on the same chart) :
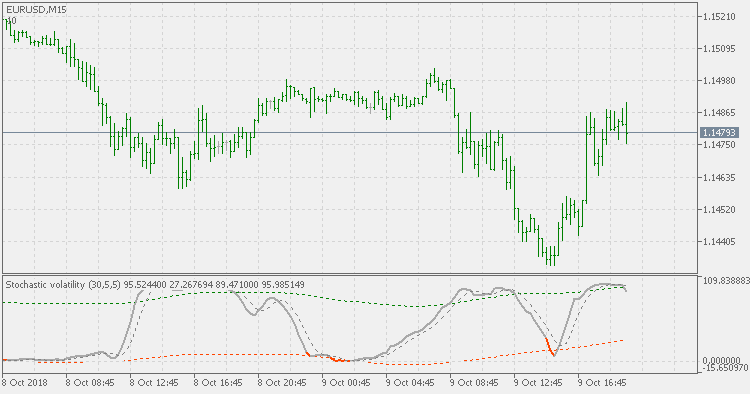
And here is the "2" alone :
The on-chart version helps you identify exactly what bars are in question that are "candidates" for change in trend or market conditions following (like on the "big picture" example bellow).