Join our fan page

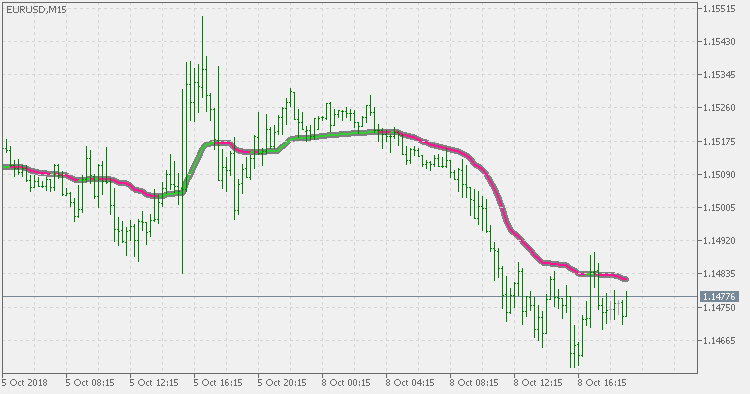
Vidya - indicator for MetaTrader 5

- Views:
- 11051
- Rating:
- Published:
- Updated:
-
 You are missing trading opportunities:
- Free trading apps
- Over 8,000 signals for copying
- Economic news for exploring financial markets
Registration Log inYou agree to website policy and terms of use
If you do not have an account, please register -
 Need a robot or indicator based on this code? Order it on Freelance
Go to Freelance
Need a robot or indicator based on this code? Order it on Freelance
Go to Freelance
Basics:
Variable Index Dynamic Average (VIDYA) technical indicator was developed by Tushar Chande.
It is an original method of calculating the Exponential Moving Average (EMA) with the dynamically changing period of averaging. Period of averaging depends on the market volatility; as the measure of volatility Chande Momentum Oscillator (CMO) is used.
This version:
There are Vidya indicators that are already doing the calculation the way how Tushar Chande describes it. The issue is actually in the way how CMO is calculated. The way how CMO is usually calculated makes it quite inefficient (try it for longer periods). This version fixes that and, as far as speed of execution is concerned, there is practically no difference if you use short or long periods so it can be used in regular trading and in testing without a danger of having too long calculations.
Usage:
You can use the color change for signals.