Join our fan page

Hurst_Bands - indicator for MetaTrader 5
- Views:
- 7766
- Rating:
- Published:
-
 You are missing trading opportunities:
- Free trading apps
- Over 8,000 signals for copying
- Economic news for exploring financial markets
Registration Log inYou agree to website policy and terms of use
If you do not have an account, please register -
 Need a robot or indicator based on this code? Order it on Freelance
Go to Freelance
Need a robot or indicator based on this code? Order it on Freelance
Go to Freelance
James (Jim) M. Hurst bands form % of bands around the median calculated using the Hurst equation. External bands (called ExtremeBands) mean extreme overbought/oversold conditions. Internal bands mean potential price return points. They also act as dynamic support/resistance levels.
The indicator has seven adjustable parameters:
- Period - calculation period
- Inner value - internal bands deviation value
- Outer value - external bands deviation value
- Extreme value - extreme bands deviation value
- Show extreme lines - display the lines of extreme values
- Show outer lines - display the lines of external values
- Show inner lines - display the lines of internal values
Calculation:
Center   = MA[Period/2-1]
HExtreme = Center * (1+Extreme value/100)
LExtreme = Center * (1-Extreme value/100)
HOuter   = Center * (1+Outer value/100)
LOuter   = Center * (1-Outer value/100)
HInner   = Center * (1+Inner value/100)
LInner   = Center * (1-Inner value/100)
where:
MA = SMA(PRICE_MEDIAN, Period)
Hurst bands are often used together with Hurst oscillator, in particular, to search for divergences between bands and oscillator lines.
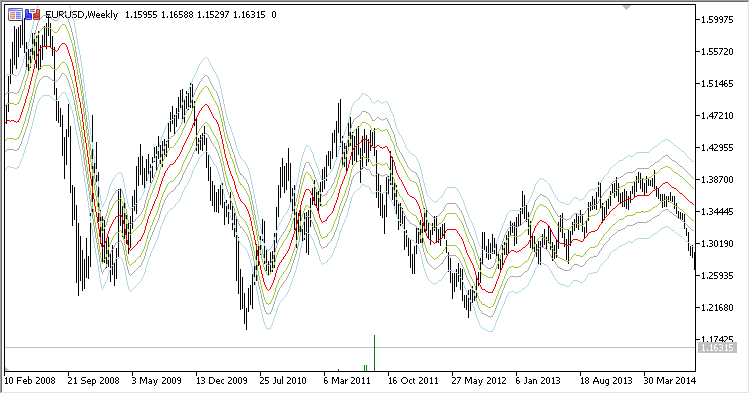
Fig. 1. Hurst bands
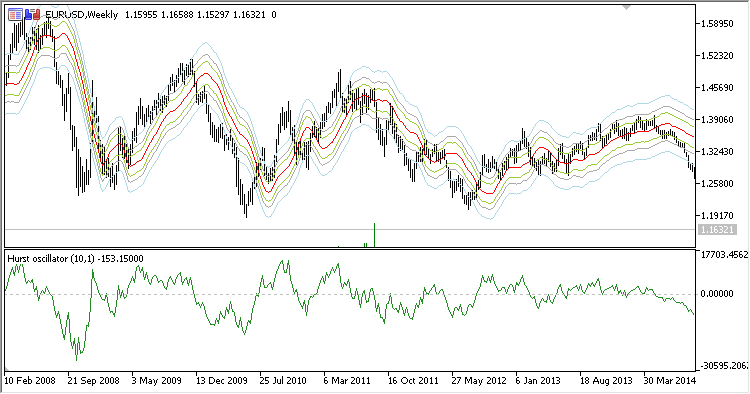
Fig. 2. Hurst bands and Hurst oscillator
Translated from Russian by MetaQuotes Ltd.
Original code: https://www.mql5.com/ru/code/22195
XHullTrend_Digit_System
The indicator implements a breakout system using the XHullTrend_Digit indicator cloud
Hurst_Oscillator
Hurst oscillator indicator