Watch how to download trading robots for free
Find us on Telegram!
Join our fan page
Join our fan page
You liked the script? Try it in the MetaTrader 5 terminal

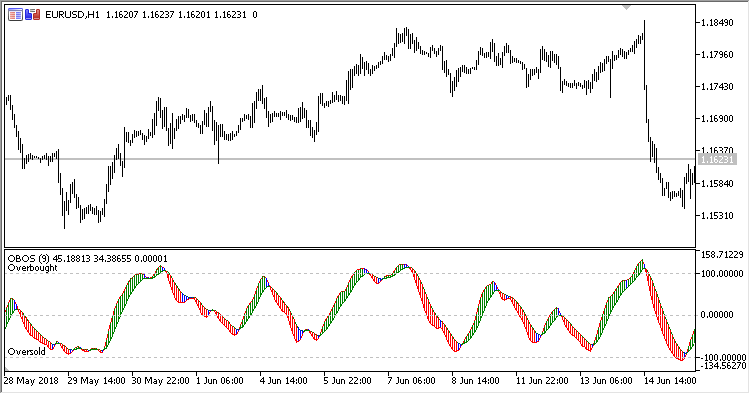
OBOS - indicator for MetaTrader 5
- Views:
- 12954
- Rating:
- Published:
-
 You are missing trading opportunities:
- Free trading apps
- Over 8,000 signals for copying
- Economic news for exploring financial markets
Registration Log inYou agree to website policy and terms of use
If you do not have an account, please register -
 Need a robot or indicator based on this code? Order it on Freelance
Go to Freelance
Need a robot or indicator based on this code? Order it on Freelance
Go to Freelance
Overbought/Oversold oscillator displays the market movement direction color histogram in a separate window.
The indicator has three input parameters:
- Period - calculation period
- Overbought - overbought level
- Oversold - oversold level
Calculation:
Up = EMA(EMA((WP-EMA(WP)) / StdDev(WP)))
Down = EMA(Up, Period)
where:
EMA - EMA(PRICE_WEIGHTED, Period)
StdDev - StdDev(PRICE_WEIGHTED, Period)
WP - weighted price (High+Low+Close+Close)/4
The upward movement is displayed by the green histogram
The downward movement is displayed by the red histogram
Uncertain movement is displayed by the gray histogram
Translated from Russian by MetaQuotes Ltd.
Original code: https://www.mql5.com/ru/code/22186