Join our fan page

ROCX - indicator for MetaTrader 5
- Views:
- 4985
- Rating:
- Published:
-
 You are missing trading opportunities:
- Free trading apps
- Over 8,000 signals for copying
- Economic news for exploring financial markets
Registration Log inYou agree to website policy and terms of use
If you do not have an account, please register -
 Need a robot or indicator based on this code? Order it on Freelance
Go to Freelance
Need a robot or indicator based on this code? Order it on Freelance
Go to Freelance
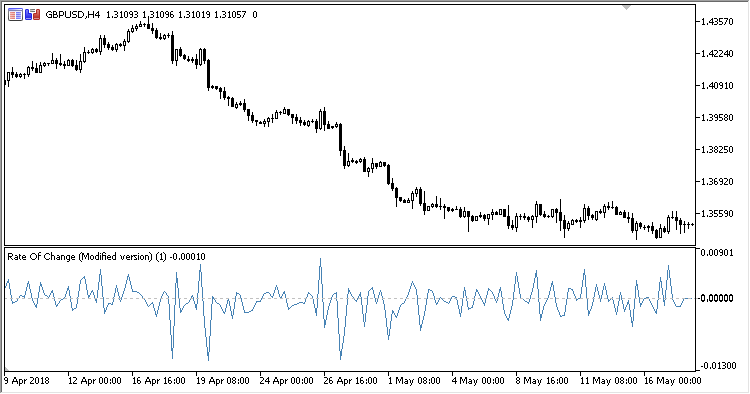
ROCX is a modified ROC (Rate Of Change) indicator displaying an absolute or relative price change.
It is calculated as (current - previous) / previous, not (current / previous - 1).
Three display modes:
- Absolute value;
- Percent of the previous value;
- 1/10 percent of the previous value.
The indicator has three input parameters:
- Period - calculation period;
- Applied price;
- Mode - mode:
- Absolute value - absolute value;
- % value - percent of the previous value;
- %1/10 value - 1/10 percent of the previous value.
Calculations:
-
Absolute value:
ROCX = diff
-
% value:
ROCX = 100.0 * diff / PrN
-
% 1/10 value:
ROCX = 1000.0 * diff / PrN
where:
diff = Applied price - Applied price[Period]
PrN = Applied price[Period]
Translated from Russian by MetaQuotes Ltd.
Original code: https://www.mql5.com/ru/code/21666
PFE_Overlay
The Polarized Fractal Efficiency Overlay (PFE_Overlay) indicator is designed for identifying trends. Unlike Polarized Fractal Efficiency, the indicator is displayed on the price chart as the main indicator line and two lines of the calculated StdDev deviation value.
PFE
The Polarized Fractal Efficiency (PFE) indicator is designed for identifying trends.
ColorXPWMA_Digit
A colored smoothed PWMA that displays the most recent value as a price label with the possibility to round the indicator levels up to a required number of digits.
Trend_Intensity_Index
The Trend Intensity Index oscillator displayed as a color histogram.