Join our fan page

OHLC_Volume - indicator for MetaTrader 5
- Views:
- 6306
- Rating:
- Published:
- Updated:
-
 You are missing trading opportunities:
- Free trading apps
- Over 8,000 signals for copying
- Economic news for exploring financial markets
Registration Log inYou agree to website policy and terms of use
If you do not have an account, please register -
 Need a robot or indicator based on this code? Order it on Freelance
Go to Freelance
Need a robot or indicator based on this code? Order it on Freelance
Go to Freelance
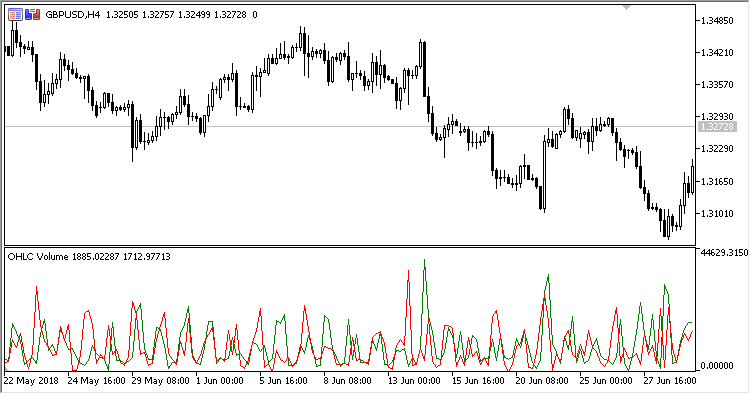
OHLC Volume displays two volume graphs considering Open, High, Low and Close and applying two calculation methods: High-Open and Close-Low.
Since it is calculated only by OHLCV bar values, the indicator has no configurable parameters.
Calculation:
Vol UP = Volume * CoeffUP/(CoeffUP+CoeffDN)
Vol DN = Volume* CoeffDN/(CoeffUP+CoeffDN)
where:
CoeffUP = High-Open
CoeffDN = Close-Low
Translated from Russian by MetaQuotes Ltd.
Original code: https://www.mql5.com/ru/code/21402
AMA Histogram
The histogram displays the difference of a Close price and iAMA (Adaptive Moving Average, AMA) indicator value.
 MostasHaR15 Pivot
The EA uses the following indicators: iADX (Average Directional Movement Index, ADX), two iMAs (Moving Average,MA) - one indicator at CLOSE prices and another one at OPEN prices, iOsMA (Moving Average of Oscillator, OsMA).