Join our fan page

CMC - indicator for MetaTrader 5
- Views:
- 5807
- Rating:
- Published:
-
 You are missing trading opportunities:
- Free trading apps
- Over 8,000 signals for copying
- Economic news for exploring financial markets
Registration Log inYou agree to website policy and terms of use
If you do not have an account, please register -
 Need a robot or indicator based on this code? Order it on Freelance
Go to Freelance
Need a robot or indicator based on this code? Order it on Freelance
Go to Freelance
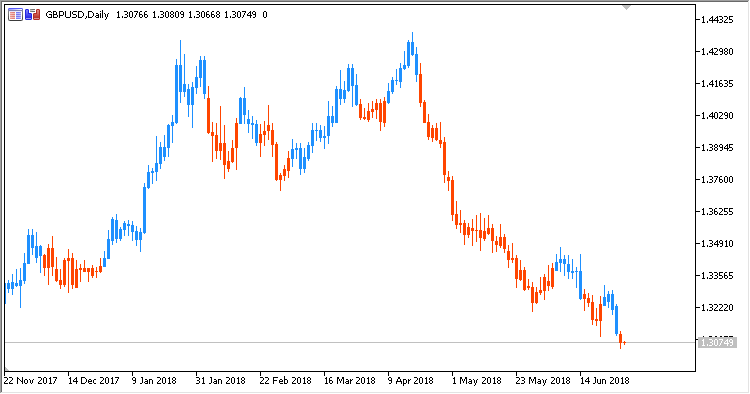
Indicator CMC (Clear Method Candles) displays colored candlesticks, based on the existing market trend. It is calculated by the "pure" method (without using any other indicators, only price) and has no configurable parameters. It is based on indicator Clear Method Histogram.
Calculations:
-
If Swing > 0, then candlesticks are blue
-
If Swing < 0, then candlesticks are red
where:
HH = Maximum(High, PrevHH)
LH = Minimum(High, PrevLH)
HL = Maximum(Low, PrevHL)
LL = Minimum(Low, PrevLL)
-
If Swing > 0 and High < HL:
Swing = -1
LL = Low
LH = High
-
If Swing < 0 and Low > LH:
Swing = 1
HH = High
HL = Low
-
Otherwise, if High < HL:
Swing = -1
LL = Low
LH = High
-
Otherwise, if Low > HL:
Swing = 1
HH = High
HL = Low
Translated from Russian by MetaQuotes Ltd.
Original code: https://www.mql5.com/ru/code/21274
CMH
Indicator CMH (Clear Method Histogram) displays a color histogram of the current market trend.
VC
Indicator VC (Volatility Channel by Larry Williams).
CRF
Indicator CRF (Cumulative Rotation Factor) displays the states of the market: Uptrends/downtrends/consolidation.
JB_Volatility
JB Volatility - market volatility oscillator marking its state in color.