Join our fan page
- Views:
- 5060
- Rating:
- Published:
-
Need a robot or indicator based on this code? Order it on Freelance Go to Freelance
PAC (Periods After Crossing MA) is an oscillator displaying the number of bars elapsed after the last crossing of the price and the moving average.
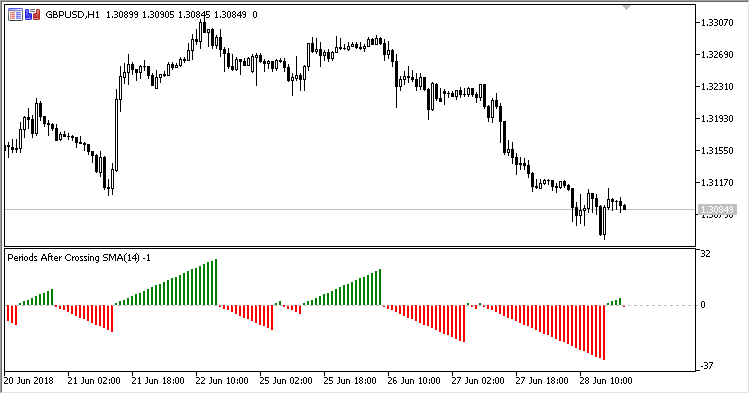
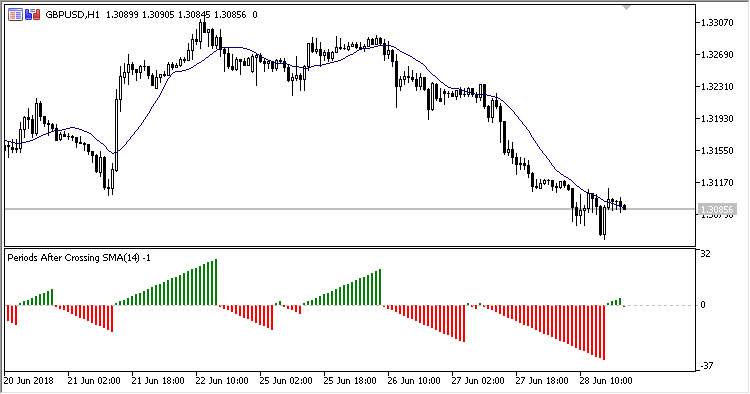
If the moving average crossed the price upwards, then the positive histogram columns are drawn in green; if the last crossing was downwards, the negative columns are drawn in red.
The indicator has three configurable parameters:
- Period - MA period;
- Method - MA calculation method;
- Applied price - MA calculation price and crossing price.
Calculations:
-
If Price > MA and PrevPrice > PrevMA:
PAC = PrevPAC + 1
-
If Price < MA and PrevPrice < PrevMA:
PAC = PrevPAC - 1
-
If Price > MA:
PAC = 1
-
If Price < MA:
PAC = -1
where:
Price - SMA(Applied price, 1)
MA - MA(Applied price, Period, Method)

Fig 1. By default, SMA(Close,14)

Fig 1. In the price chart, the SMA(Close,14)
Translated from Russian by MetaQuotes Ltd.
Original code: https://www.mql5.com/ru/code/21264
 DMI_Difference
Indicator showing the difference between the +DI and -DI of indicator ADX.
 BuffAverage
Buff Dormeier's moving average weighted by volume.
 RP
RP
Indicator RP (Range Position) displays the price position within the range (from Low to High) reached over the previous N periods.
 Self_Adjusting_RSI
In pscillator Self-Adjusting RSI, we have implemented the methods of automated adjusting the RSI oscillator overbought/oversold levels, described in David Sepiashvili's article The Self-Adjusting RSI.