Join our fan page

Repulse - indicator for MetaTrader 5

- Views:
- 7195
- Rating:
- Published:
-
 You are missing trading opportunities:
- Free trading apps
- Over 8,000 signals for copying
- Economic news for exploring financial markets
Registration Log inYou agree to website policy and terms of use
If you do not have an account, please register -
 Need a robot or indicator based on this code? Order it on Freelance
Go to Freelance
Need a robot or indicator based on this code? Order it on Freelance
Go to Freelance
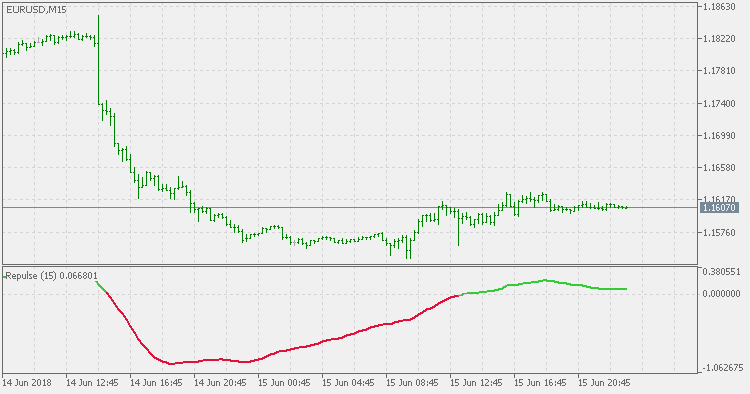
The Repulse indicator measures and displays the bullish or bearish pressure associated with each price candlestick in the form of a curve.
There is only one parameter: the repulse period. Indicator is internally using all 4 prices in calculations and that is the reason why the price can not be changed in calculation. Recommended usage is simple:
- Crossing the zero line up can be treated as buy signal.
- Crossing the zero line up can be treated as sell signal.
Log Sigmoidal Normalized T3
In this indicator T3 is sigmoidal (Softmax) normalized - made as oscillator that ranges in 0 to 1 range, and if you use hyperbolic normalization it will range from -1 to +1 range.
RSI with RSI
The five-week and 17-week RSI values are used for entry and exits while the 17-week RSI is used for trend direction as an entry filter in the retracement entries.
Log Sigmoidal Normalized Jurik MA
In this indicator Jurik MA is sigmoidal (Softmax) normalized - made as oscillator that ranges in 0 to 1 range, and if you use hyperbolic normalization it will range from -1 to +1 range.
Repulse Multi Timeframe
The Repulse Multi Timeframe indicator measures and displays the bullish or bearish pressure associated with each price candlestick in the form of a curve.