Join our fan page

CVI - indicator for MetaTrader 5
- Views:
- 6540
- Rating:
- Published:
-
 You are missing trading opportunities:
- Free trading apps
- Over 8,000 signals for copying
- Economic news for exploring financial markets
Registration Log inYou agree to website policy and terms of use
If you do not have an account, please register -
 Need a robot or indicator based on this code? Order it on Freelance
Go to Freelance
Need a robot or indicator based on this code? Order it on Freelance
Go to Freelance
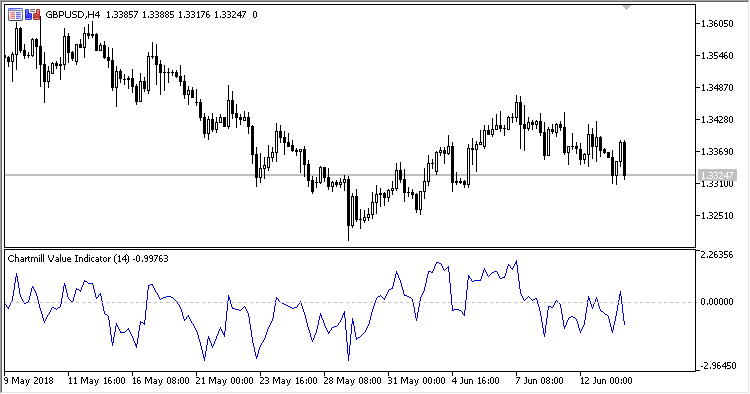
Oscillator CVI (Chartmill Value Indicator) was described by Dirk Vandycke in the Technical Analysis of Stocks & Commodities magazine in January, 2013.
CVI represents a standard deviation from moving average and can be applied to any price series over any period.
The concept is simple. As prices grow, they will finally move away from the moving average. At the end, the moving average will also start growing. When prices start flatting out or consolidating, the gap between the prices and the moving average will start decrease, while the MA will continue moving inertially for some time.
As compared to other oscillators, the indicator displays overbought/oversold areas more efficiently, since the gap between the price and the MA is divided by the average true range, which strongly hardens deviating from the moving average on longer trend-following areas.
The indicator has three configured parameters:
- Period - calculation period;
- Method - Moving Average calculation method;
- Calculation mode - deviation calculation mode:
- ATR - by ATR;
- Sqrt ATR - by square root of ATR.
Calculation:
where:
VC = MedianMA(Period, Method)
ATR - Average True Range(Period)
If Calculation mode = ATR:
otherwise:
Translated from Russian by MetaQuotes Ltd.
Original code: https://www.mql5.com/ru/code/21105