Join our fan page

CADX - indicator for MetaTrader 5
- Views:
- 6678
- Rating:
- Published:
-
 You are missing trading opportunities:
- Free trading apps
- Over 8,000 signals for copying
- Economic news for exploring financial markets
Registration Log inYou agree to website policy and terms of use
If you do not have an account, please register -
 Need a robot or indicator based on this code? Order it on Freelance
Go to Freelance
Need a robot or indicator based on this code? Order it on Freelance
Go to Freelance
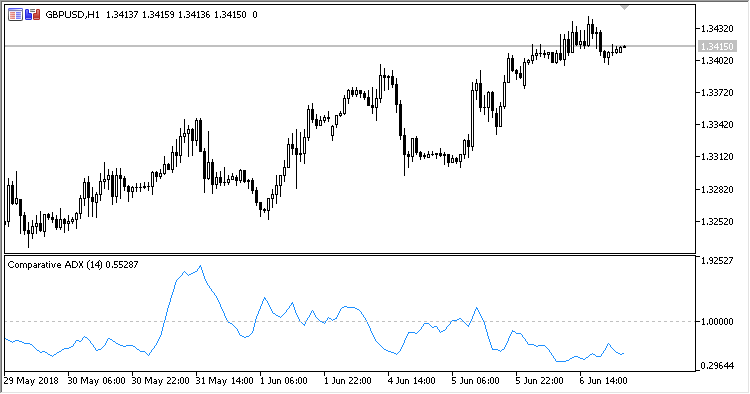
Oscillator Comparative ADX indicates the relative trend strength, based on the smoothed values of the five main currency pairs: EURUSD, GBPUSD, AUDUSD, USDJPY, and USDCAD, and of the instrument, on which the indicator is running.
USDCHF is excluded from the list of the indicator symbols to be calculated, since it is historically reversing as to EURUSD.
It has two parameters:
- Period - ADX calculation period;
- Level value - threshold level value (*).
Calculation:
where:
Current ADX - the ADX value of the current symbol
Average ADX = (ADX(EURUSD, Period) + ADX(GBPUSD, Period) + ADX(AUDUSD, Period) + ADX(USDJPY, Period) + ADX(USDCAD, Period)) / 5
* Values above 1.0 (Level value) are considered a stable trend.
It should be noted that, at the first launch or at switching the timeframe, the indicator will need some time to download the history for all the symbols used on the current chart timeframe. If there are no ticks for drawing the indicator's line, it will be worth it to switch the timeframe once, since, even upon having downloaded all necessary history, the indicator has to be re-calculated when a new tick appears (if there are no ticks, it will be re-calculated when you switch the timeframe).
Translated from Russian by MetaQuotes Ltd.
Original code: https://www.mql5.com/ru/code/20996
WAMI
A.W. Warren's Momentum Indicator
VolatilityMA
A moving average with a changeable calculation period.
FTNP
Indicator Fisher Transform of Normalized Prices
AbsolutelyNoLagLwma_x2_cloud_HTF
Two indicators AbsolutelyNoLagLwma from different timeframes, the area between lines being filled with a cloud, the color of which corresponds with the trend direction on the market