Join our fan page
- Views:
- 3687
- Rating:
- Published:
-
Need a robot or indicator based on this code? Order it on Freelance Go to Freelance
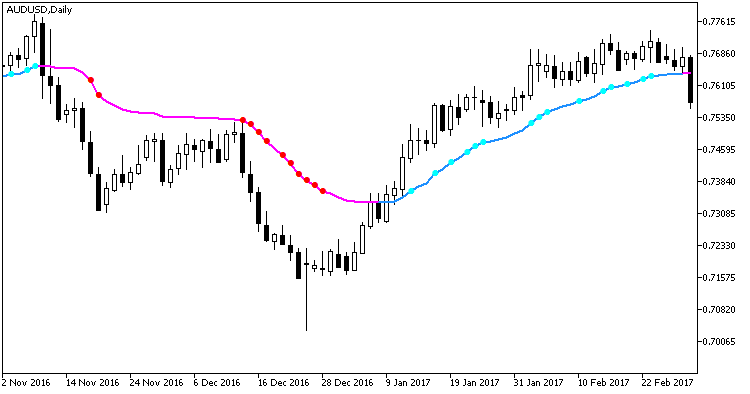
The EMAVFS indicator with additional trend strength indication using colored dots based on the standard deviation algorithm.
If the standard deviation of the EMAVFS indicator is between the dK1 and dK2 parameter values, then a small colored dot appears on the moving average. Its color corresponds to the current trend direction.
input double dK1=1.5; // Square-law filter coefficient 1
input double dK2=2.5;  // Square-law filter coefficient 2
If the standard deviation becomes higher than the dK2 input parameter value, then the dot size increases. Thus, we get three levels of trend strength indication.
- Weak — no dots;
- Medium — small colored dots;
- Strong — big colored dots.

Fig.1. Indicator EMAVFS_StDev
Translated from Russian by MetaQuotes Ltd.
Original code: https://www.mql5.com/ru/code/20720
 ID_Close_Rectangle_TL_AL
A utility for closing (reducing the right side of the length) the rectangles, trendlines, or lines with arrows to some bars/candlesticks.
 EMAVFS_channel_HTF
Indicator EMAVFS_channel with the timeframe selection option available in input parameters.
 TST
TST
The Expert Advisor does not use any indicators. It only uses the current price and the OHLC of zero bar.
 Four horizontal lines
The indicator plots four horizontal lines: Two basic ones (red by default) above the High and below the Low of the "Bar number" bar and help lines (green by default) shifted from the basic ones.