Join our fan page

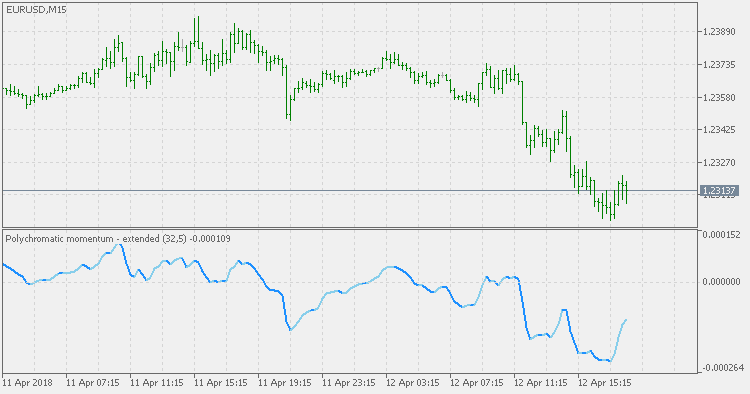
Polychromatic Momentum - extended - indicator for MetaTrader 5

- Views:
- 9344
- Rating:
- Published:
-
 You are missing trading opportunities:
- Free trading apps
- Over 8,000 signals for copying
- Economic news for exploring financial markets
Registration Log inYou agree to website policy and terms of use
If you do not have an account, please register -
 Need a robot or indicator based on this code? Order it on Freelance
Go to Freelance
Need a robot or indicator based on this code? Order it on Freelance
Go to Freelance
Denis Meyers that invented Polychromatic Momentum, describes it as:
Momentum is defined as the difference, or percent change, between the current bar and a bar some lookback period in the past. The major problem with using momentum based indicators is that the optimum lookback period seems to change over time creating losses with the current chosen lookback period.
To avoid the errors due to a single lookback period we create an indicator that takes an weighted average of all significant lookback periods for the tradable. We named this indicator polychromatic because poly means many and chromatic means colors. Thus, Polychromatic Momentum for this indicator translates into the sum of many Momentums.
The Polychromatic Momentum is by all means a useful indicator. But, as many "raw" momentum indicators do, when used without any form of smoothing, the usefulness of it is somewhat limited by the fact that it "overreacts" to even small changes in some situations, and that makes it difficult to be used for signals.
This version is using double smoothed EMA for smoothing. DSEMA has been proven for producing very good smooth results with a lag that is almost non-existent, hence, in combination with it, the Polychromatic Momentum indicator becomes much more usable when it comes to signals.
Polychromatic Momentum
Polychromatic momentum takes an weighted average of all significant lookback periods for the tradable.
Vortex
Two lines representing positive and negative directional movement. These will intersect and cross during a change of trend and diverge wider and wider as the strength of the trend increases.
Composite Index
The Composite Index was developed to solve the divergence failure problem in the RSI, but its ability to provide specific horizontal levels of support within the indicator adds to its value. The Composite Index takes the normalized formula of RSI and removes the normalization range restrictions. The formula for the Composite Index uses an embedded momentum calculation with a short-term RSI smoothed.
Synthetic RSI
Instead of using one RSI, the Synthetic RSI indicator is using 3 instances of RSI. Those 3 instances of RSI are then used to calculate the "synthetic" value (that is not an average of the 3 since the calculation differs from an average).