Join our fan page
- Views:
- 3758
- Rating:
- Published:
- Updated:
-
Need a robot or indicator based on this code? Order it on Freelance Go to Freelance
The averaged non-trivial linear combination of iRSI and iDeMarker implemented as a color histogram.
Indicator calculation formula:
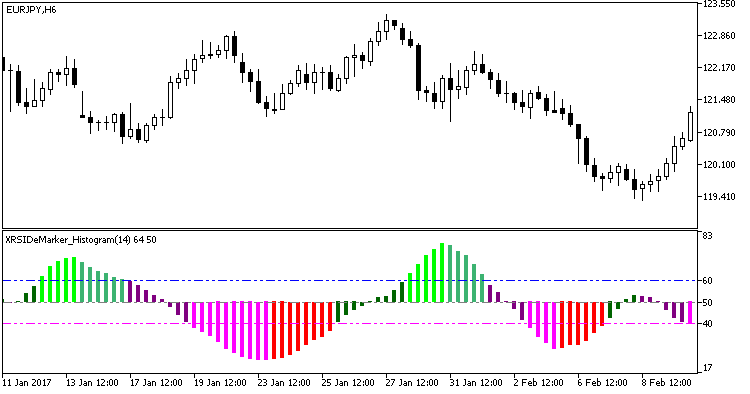
The growth of a financial asset is usually accompanied by the growth of the indicator and the green color of the histogram. An asset is considered falling if the indicator is falling and the histogram is pink. The optimal time to perform a trade is when the color of the histogram bars changes.
The indicator uses SmoothAlgorithms.mqh library classes (copy it to <terminal_data_folder>\MQL5\Include). The classes were described in detail in the article Averaging Price Series for Intermediate Calculations Without Using Additional Buffers.

Fig1. The XRSIDeMarker_Histogram indicator.
Translated from Russian by MetaQuotes Ltd.
Original code: https://www.mql5.com/ru/code/20107
 KWAN_NRP
A simple oscillator, which is based on the values of the iStochastic, iRSI and iMomentum indicators and is implemented as a two-colored histogram.
 Sar_HTF
The iSAR indicator with the possibility to change the indicator timeframe in input parameters, implemented in color.
 XRSIDeMarker_Histogram_HTF
The XRSIDeMarker_Histogram indicator with the possibility to change the indicator timeframe in input parameters.
 KWAN_NRP_HTF
The KWAN_NRP indicator with the possibility to change the indicator timeframe in input parameters.