Join our fan page

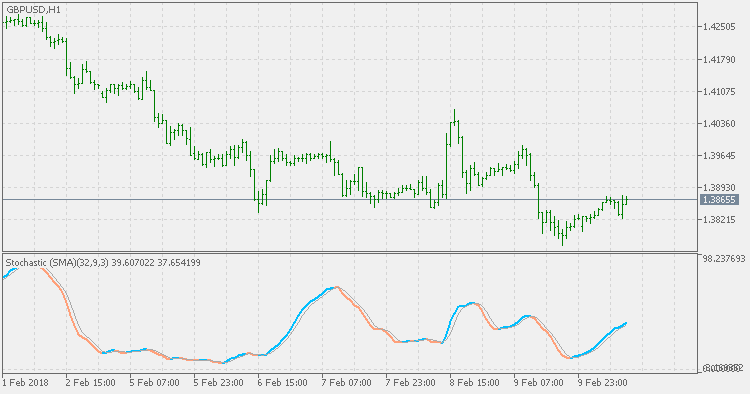
Stochastic Extended - indicator for MetaTrader 5

- Views:
- 7799
- Rating:
- Published:
-
 You are missing trading opportunities:
- Free trading apps
- Over 8,000 signals for copying
- Economic news for exploring financial markets
Registration Log inYou agree to website policy and terms of use
If you do not have an account, please register -
 Need a robot or indicator based on this code? Order it on Freelance
Go to Freelance
Need a robot or indicator based on this code? Order it on Freelance
Go to Freelance
The Stochastic Oscillator is a Momentum indicator comparing the closing price of a security to the range of its prices over a certain period of time. The sensitivity of the oscillator to market movements is reducible by adjusting that time period or by taking a moving average of the result.
The Stochastic Oscillator is calculated using the following formula:
Where:
- C - the most recent closing price.
- L(period) - the low of the (period) previous trading sessions.
- H(period) - the highest price traded during the same (period)-sessions period.
- %K - the current market rate for the currency pair.
- %D - (signal)-period moving average of %K.
The general theory serving as the foundation for this indicator is that in a market trending upward, prices will close near the high, and in a market trending downward, prices close near the low. Transaction signals are created when the %K crosses through a three-period moving average, which is called the %D.
The usual average that is used for stochastic calculation is simple moving average (SMA). This version allows you to use any of the 4 basic types of averages (default is SMA, but you can use EMA, SMMA or LWMA too) - some are "faster" then the default version (like EMA and LWMA versions) and SMMA is a bit "slower" but this way you can fine tune the "speed" to signals ratio.
T3 Stochastic Momentum Index
This version is doing the calculation in the same way as the original Stochastic Momentum Index, except in one very important part: instead of using EMA (Exponential Moving Average) for calculation, it is using T3. That produces a smoother result without adding any lag.
Stochastic Momentum Index
The Stochastic Momentum Index (SMI) was developed by William Blau and was introduced in the January 1993 issue of Technical Analysis of Stocks & Commodities magazine. It incorporates an interesting twist on the popular Stochastic Oscillator. While the Stochastic Oscillator provides you with a value showing the distance the current close is relative to the recent x-period high/low range, the SMI shows you where the close is relative to the midpoint of the recent x-period high/low range.
Fisher RVI
This indicator has an addition of Fisher Transform to the RVI. The Fisher Transform enables traders to create a nearly Gaussian probability density function by normalizing prices. In essence, the transformation makes peak swings relatively rare events and unambiguously identifies price reversals on a chart. The technical indicator is commonly used by traders looking for extremely timely signals rather than lagging indicators.
Inverse Fisher RVI
The Inverse Fisher Transform normalizes the values in the desired range (-1 to +1 in this case) which helps in assessing the overbought and oversold market conditions.